During the Great Recession, unemployment rates across the United States soared as labor market conditions deteriorated. Over the past seven years, unemployment rates have declined steadily, albeit with regional variation. As labor markets normalize in many areas, it is important to understand the rate of employment growth needed to keep labor markets stable. This rate differs across states due in large part to differences in population growth and labor force participation. This issue of the Rocky Mountain Economist discusses the components of the labor market and estimates the amount of employment growth needed to maintain stable labor markets in Colorado, New Mexico and Wyoming.
Labor Market Components
Recessions frequently are associated with job losses, and the 2007-09 recession was a prime example as many workers lost their jobs or struggled to find one. The national unemployment rate, which rose to 10.0 percent in October 2009, since has declined to 4.2 percent as of September 2017. Unemployment rates also have fallen considerably across all of the Rocky Mountain States. Despite improvement, current labor market conditions vary across Colorado, New Mexico and Wyoming as the strength of the recovery has been mixed among each.
The labor force is constantly evolving as people enter the workforce, retire or leave the workforce for other reasons. Labor force growth is critical in determining the number of new jobs needed to keep unemployment rates steady. i How quickly the labor force changes is directly affected by changes in the population. For example, if the entire population participated in the labor force, population growth would equal labor force growth. In this scenario, the amount of employment growth needed to keep the unemployment rate steady would be equal to the change in the population. However, if the population increases at a faster pace than employment, the unemployment rate would rise.
Of course, not everyone in the population participates in the labor force. For example, some of the population is too young to be employed, while others are students and some have retired. Therefore, to understand how quickly employment must grow to hold unemployment rates steady, we also need to know the labor force participation rate, which is the percentage of the population that participates in the labor force. Any change in the labor force participation rate also can directly affect the rate of employment growth needed. For example, if the labor force participation rate declines and employment and population remain unchanged, then unemployment rates will fall. The labor force participation rate can change for a variety of reasons, including changing demographics (larger retired population), changing education patterns (individuals remaining in school longer), changing household working patterns (single-earner versus dual-earner households) or economic conditions (individuals may enter the workforce when economic conditions are strong and exit when fewer job opportunities exist).
Therefore, changes in the population and changes in the labor force participation rate affect changes in the overall labor force. Chart 1 shows the growth in population, the change in labor force participation rates and the growth in the labor force from 1980 to 2016. Over the entire period, the labor force grew slightly slower than the population because labor force participation rates fell. However, this trend has shifted over time.
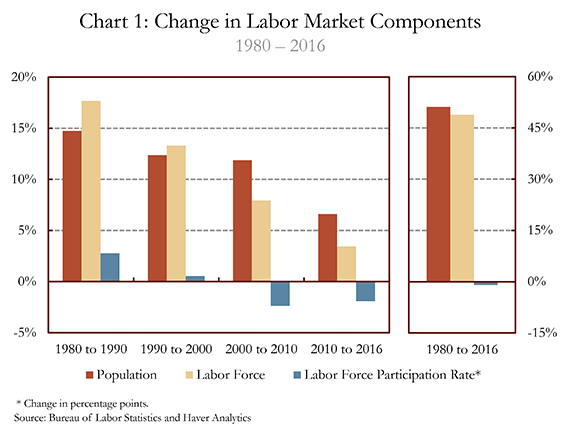
In the 1980s, the labor force expanded much faster than the population as labor force participation rates increased. This was due primarily to a large increase in the participation of women in the workforce that started in the 1960s and grew steadily until the late 1990s. As the surge of women entering the workforce slowed, the growth in the labor force began to slow and moved closer toward population growth in the 1990s.
By contrast, the labor force expanded much slower than population growth in the 2000s, and in the most recent period, labor force growth slowed to almost half that of population growth. Part of the slowdown in labor force growth can be attributed to weakness in the economy during this period primarily due to the severe recession that started in late 2007. As economic conditions deteriorated, some individuals who previously had been in the labor market dropped out; some may have stopped looking for employment because they did not believe they could find a job.
In addition to economic factors, another important and anticipated driver behind the decrease in labor force growth is the aging of the population. The baby-boom generation, born between about 1946 and 1964, began to reach age 65 in 2011 and started to retire in large numbers. As this large population cohort enters retirement, it leaves the labor force and puts downward pressure on the labor force participation rate and the pace of labor force growth.
A Stable Labor Market
Unemployment rates rose quickly during the 2007-09 recession as the number of job losses greatly outnumbered the number of new jobs added. Over the past seven years, labor market conditions have improved and unemployment rates have steadily declined in the United States. Unemployment rates decline when the rate of employment growth exceeds labor force growth. Since labor force growth depends on both population growth and changes in labor force participation rates, unemployment rates can decline if employment growth exceeds population growth, if labor force participation rates decline, or a combination of the two.
Chart 2 shows the monthly break-even level of employment growth and actual employment growth for the United States over the last 10 years.ii The break-even level of employment growth in this chart is a measure of how quickly employment needs to expand to keep pace with population growth assuming that labor force participation rates remain constant. When actual employment growth is above the break-even line, either the unemployment rate decreases and/or the labor force participation rate increases. When actual employment is below the break-even line, the unemployment rate increases and/or the labor force participation rate decrease.
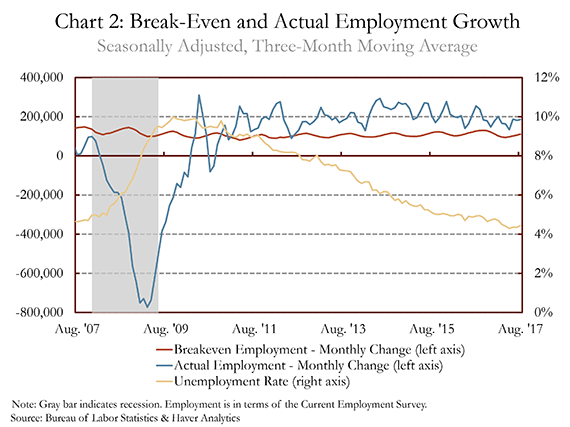
During the recession, denoted by the gray bar, actual employment growth was well below the break-even level of employment, which consequently led to a sharp increase in the unemployment rate as well as a decrease in the labor force participation rate. Over the past seven years, actual employment mostly has been above the break-even line, which has led to a steady decline in the unemployment rate. In the first few years of the recovery, the decline in the unemployment rate was due to both strong employment growth and declines in the labor force participation rate. Over the past few years, however, the labor force participation rate has held steady as new entrants into the labor force have offset the retiring baby-boom generation.
Future Employment Growth Needed for Stable Labor Markets in the Rocky Mountain States
Looking forward, it is possible to calculate the pace of employment growth needed to keep unemployment rates flat assuming that population growth continues to expand at its current pace and labor force participation rates remain steady. The most recent monthly break-even level of employment for the United States, Colorado and New Mexico were about 113,000, 3,600, and 170, respectively. Put another way, year-over-year percent change in employment growth for the United States, Colorado and New Mexico would have to be 1.4 percent, 1.7 percent and 0.4 percent, respectively. Wyoming had a break-even level of zero because the monthly population change for the most recent month available, August 2017, also was zero. If population is expected to remain the same, than no new jobs will need to be added on net as the labor force growth also will be zero.iii
Understanding the break-even level of employment growth for each state helps provide a better interpretation of current employment numbers. For example, since population is growing faster in Colorado than in New Mexico and Wyoming, Colorado needs faster employment growth to hold unemployment rates steady.
Using projections of statewide population growth and labor force participation rates, it is possible to calculate the rate of employment growth needed to keep pace with the projected labor force growth in the coming years. Chart 3 shows actual average annual employment growth from 2011-16, and then the average annual percent change in employment needed to maintain stable unemployment rates under various assumptions for the United States, Colorado, New Mexico and Wyoming through 2030.
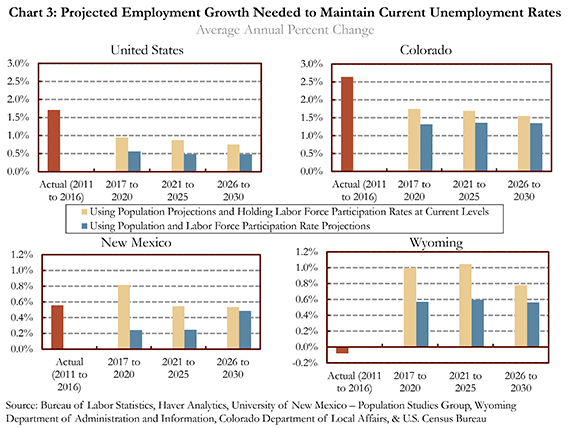
The yellow bars in Chart 3 represent the employment growth needed to keep pace with population growth projections through 2030. This is the employment growth needed to keep unemployment rates steady assuming that the labor force participation rates remain at 2016 levels. Since population is the only indicator changing in this scenario, the employment growth rates represented by the yellow bars are equal to the projected growth rates of population.iv Looking at the yellow bars, employment needs to expand 1.7 percent annually in Colorado, 0.8 percent annually in New Mexico and 1.0 percent annually in Wyoming to keep unemployment rates steady between 2017 and 2020 if labor force participation rates remain unchanged.
The population growth rates for the United States, Colorado and New Mexico are expected to slow steadily over the coming years, shown by the decreasing yellow bars. Specifically, annual population growth for the United States is expected to slow from 1.0 percent in 2017 to 0.7 percent in 2030. The average population growth in Wyoming, on the other hand, is expected to be slightly faster in 2021-25 compared to 2017-20. This is primarily due to relatively slow growth expected in the near term, which significantly brings down the average for 2017-20.
The blue bars represent the employment growth needed to hold unemployment rates steady if population growth projections are used and labor force participation rates are allowed to change. In order to estimate the change in labor force participation rates, population projections by age cohort are used to calculate the effect of an aging population on total labor force participation rates. As previously mentioned, as the sizable baby-boomer cohort moves into retirement, it naturally will put downward pressure on the labor force participation rate. For example, about 19 percent of the U.S. population was 65 and older in 2016, but this is expected to increase to about 25 percent in 2030. Assuming that labor force participation rates remain unchanged within each age cohort, the change in demographics alone between 2016 and 2030 is estimated to lower the labor force participation rate from 62.8 percent in 2016 to 59.8 percent in 2030.
Since labor force participation rates are expected to decline in the coming years, the rate of employment growth needed to maintain stable unemployment rates is lower in the blue bars (which account for population growth and LFPRs). For the United States, Colorado, and New Mexico, the labor force participation rate is declining most quickly between 2017 and 2020. Although the labor force participation rate is expected to continue to decline between 2020 and 2030, the pace of decline slows. Therefore, the difference between the employment growth rate needed in the yellow bar and blue bar is largest in the period 2017 to 2020. Wyoming, on the other hand, is projected to experience the fastest rate of decrease in its labor force participation rate in 2023 which is why the spread between the yellow and blue bars is the largest in 2021 to 2025.
In order to keep unemployment rates steady and assuming that labor force participation rates decline due to an aging population, employment needs to increase 1.3 percent annually in Colorado, 0.2 percent annually in New Mexico and 0.6 percent annually in Wyoming between 2017 and 2020. The estimates shown in Chart 3 all assume that unemployment rates hold steady at 2016 levels. In order to decrease unemployment rates in a state, employment would need to expand faster than the estimates shown in Chart 3.
Conclusion
Each state requires a different level of employment growth in order to keep unemployment rates steady. The level of employment growth required is dependent on the growth of the labor force, which is a function of both population growth and the labor force participation rate. Looking ahead, population growth and labor force participation rates are expected to decrease, and therefore, a slower pace of employment growth will be needed in order to hold unemployment rates steady.
End notes
i. The labor force consists of those who are employed plus those who are unemployed and are actively looking for a job.
ii. The break-even level of employment is based off of the following relationship: employmentt = populationt x participation ratet-1 x (1- unemployment rate(t-1)) x (payroll employmentt / household employmentt)
iii. This methodology follows research by the Center for Human Capital Studies at the Federal Reserve Bank of Atlanta. The numbers presented in this paper differ slightly due to rounding. Additional information can be found at: https://www.frbatlanta.org/chcs/calculator.aspx?panel=1
iv. Population projections for the United States are from the U. S. Census Bureau. Population projections for the Rocky Mountain States are from the Colorado Department of Local Affairs, University of New Mexico–Population Studies Group and the Wyoming Department of Administration and Information.
v. Labor force participation rates by age cohort are assumed to remain at their 2016 levels, while the size of each cohort changes according to their respective population projections. This allows for the calculation of a total labor force participation rate provided by the new age composition of future populations.