Migration can play an important role in regional economic growth by affecting the size and composition of the labor force and potentially the overall spending base of the population. Individuals choose to migrate for a variety of reasons such as regional or geographic preferences, job opportunities, family, lifestyles, amenities and even weather. This issue of the Rocky Mountain Economist analyzes migration patterns in Colorado, New Mexico and Wyoming and describes the characteristics of domestic migrants including age, income and education.
Net Migration and Population Change
Migration influences a region’s economic growth by affecting population growth and therefore the growth of the region’s labor force. Simultaneously, migration patterns also can reflect differences in current economic conditions across regions as some individuals move to areas where job opportunities are more plentiful. Within the Rocky Mountain States, migration patterns have varied widely across states and over time (Chart 1). Population growth and net migration follow a similar pattern over time as migration tends to be the primary driver of short-term volatility in overall population growth. Natural population growth (births minus deaths) is the other component that affects population growth, and it typically follows longer-term trends. For example, natural population growth in the United States has been falling gradually since the 1990s, due primarily to decreasing fertility rates. Natural population growth is represented in Chart 1 as the difference between total population growth and net migration. As natural population growth has slowed over time, domestic and international migration have played a larger role in overall population growth.
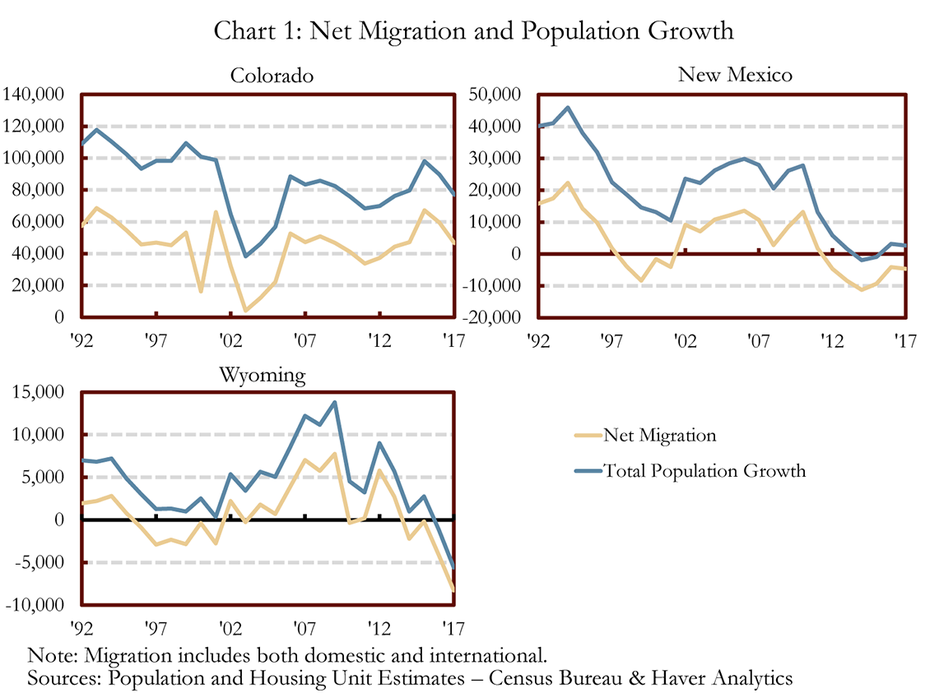
Colorado long has been an attractive destination for migrants, and Chart 1 shows a positive net migration during the past 25 years. However, during that time the level of migration has fluctuated. For example, net migration fell sharply following the 2001 recession as the state was hit hard by the sharp decline in the technology sector. More recently, the state has experienced consistently strong net migration. Between 2010 and 2017, Colorado added about 377,000 individuals through net migration and less than 258,000 via natural population growth.i Thus, about 59 percent of Colorado’s population growth from 2010 to 2017 can be attributed to net migration.
New Mexico experienced strong net migration during the early 1990s, peaking around 22,000 in 1994 before falling steadily to a net outflow of migrants in the years leading to the 2001 recession. A steady inflow of migrants returned throughout most of the 2000s. That flow, however, has been negative since 2012 as New Mexico’s economic recovery from the 2007 recession lagged national gains, leading many individuals to seek employment opportunities in other states. Significant negative migration led to a slight decline in overall population in 2014 and 2015. Between 2010 and 2017, New Mexico lost about 27,500 residents due to net migration outflows including both domestic and international migrants.ii New Mexico attracts many migrants from other countries, with more than 21,600 international migrants moving to New Mexico between 2010 and 2017.iii
Migration trends in Wyoming respond in part to the strength of the energy sector, which plays a key role in the state’s economy. As the energy sector expands and adds jobs, many individuals move to the state to fill open positions. In contrast, as activity in the energy sector shrinks, which occurred most recently in late 2014, migration flows tend to turn negative as workers relocate to find employment opportunities elsewhere. Between 2010 and 2017, about 6,500 individuals on net left Wyoming.iv Net outflows led to a decline in Wyoming’s overall population in 2016 and 2017.
County-level Migration Patterns
Examining state-level migration patterns abstracts from the considerable variation that has occurred across counties (Map 1). Within Colorado, the Front Range has attracted the largest number of net migrants between 2010 and 2017. From Larimer and Weld counties down to Pueblo County, Colorado’s Front Range has added a net 336,000 migrants between 2010 and 2017, including 65,000 in Denver County alone. Although some of Colorado’s Front Range counties also are the most populated in the state, they also have some of the highest levels of migration as a percentage of population. For example, in Broomfield and Weld counties, respective population growth between 2010 and 2017 due to net migration alone was 17 and 13 percent. Other areas of the state also have experienced strong in-migration during this period, including communities near Durango, Grand Junction and many of the mountain resort areas.
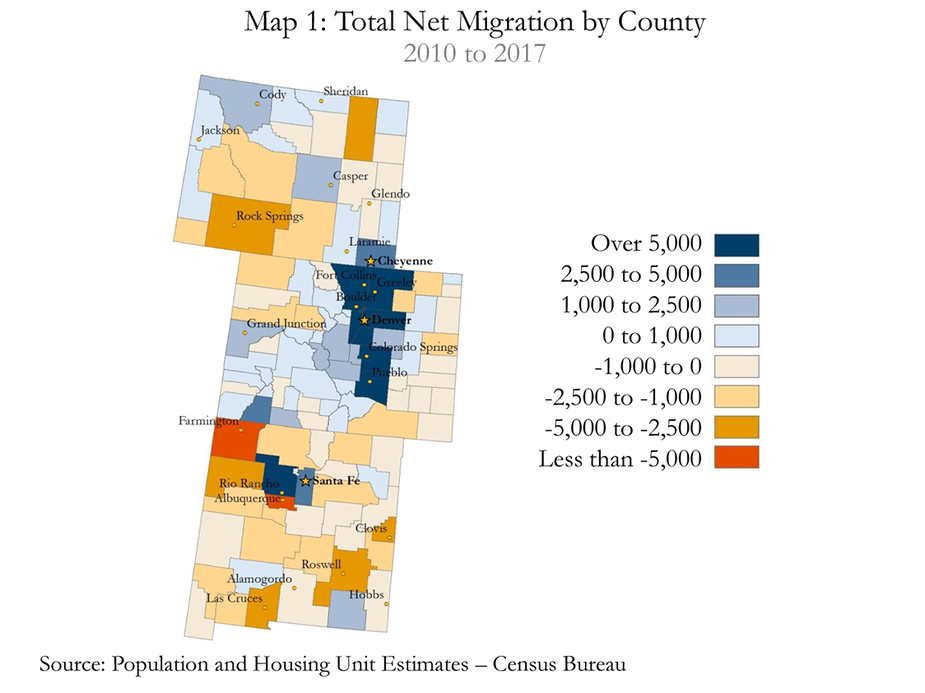
Most counties in New Mexico experienced negative net migration between 2010 and 2017, with only six of 33 counties reporting positive net migration. San Juan County, home to the city of Farmington, experienced the largest out-migration in the three-state Rocky Mountain region, with a loss of about 9,600 individuals due to net migration. Two of the relative outliers in New Mexico were Santa Fe and Sandoval counties, which experienced relatively strong inflows, adding about 7,400 and 3,000 persons, respectively, through net migration. International migration generally was a positive contributor to net migration throughout most of the state; Bernalillo County saw the largest inflow between 2010 and 2017 with almost 7,300 international migrants.v
Migration was mixed across counties in Wyoming between 2010 and 2017, with 11 counties experiencing net in-migration and 12 reporting net out-migration. The relatively highly populated counties of Sweetwater and Campbell experienced the largest migration outflow of about 2,900 and 3,600 individuals, respectively. However, the counties with the largest net migration outflow as a percentage of 2010 population were Sublette County and Uinta County, with the cumulative seven-year outflow totaling 10.3 and 8.9 percent of each county’s population in 2010, respectively. Laramie County experienced the largest net inflow of migrants with more than 2,800 additional individuals as economic growth in Cheyenne during much of this time outpaced growth in other parts of the state. In addition, Park and Natrona counties each experienced positive net migration of slightly more than 1,000 individuals.
State-to-State Net Migration
State-to-state migration patterns vary considerably across the United States, while the net migration between two states may underestimate the overall flow of migrants between them. Across the Rocky Mountain States, it is interesting to examine the top states where individuals are moving from and the top states where individuals are moving to on net (Chart 2).vi Some migration patterns are due in part to the sheer population size of the state. For example, California and Texas, the two largest states, also tend to have large migrant inflows and outflows. Additionally, migration flows between neighboring states or states with similar industries (for example, energy) are common.
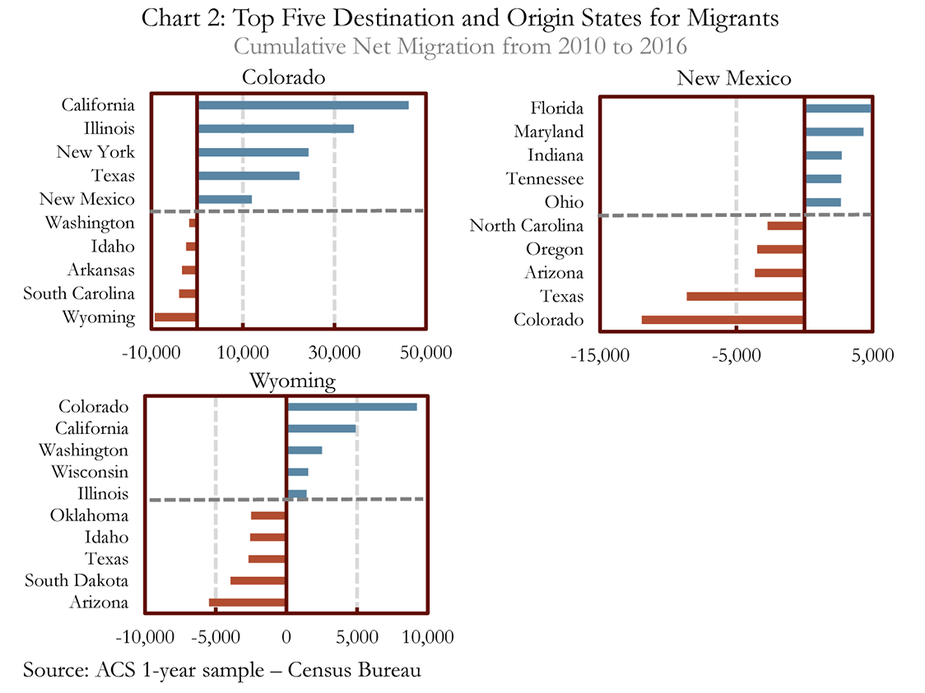
An estimated one-third of net migrants that came to Colorado from 2010 to 2016 were from California, Illinois and New York, while migrants left Colorado for Wyoming, South Carolina and Arkansas. Overall, Colorado attracted more individuals than it lost from most states. A large share of net migration to New Mexico can be attributed to individuals relocating from Florida and Maryland. However, gains from these states were not enough to offset the large number of individuals moving from New Mexico to the neighboring states of Colorado, Texas and Arizona, which in recent years have experienced stronger economies. Between 2010 and 2016, Wyoming attracted large net inflows from Colorado, California and Washington, although it also experienced strong net outflows to Arizona.
Migration by Age
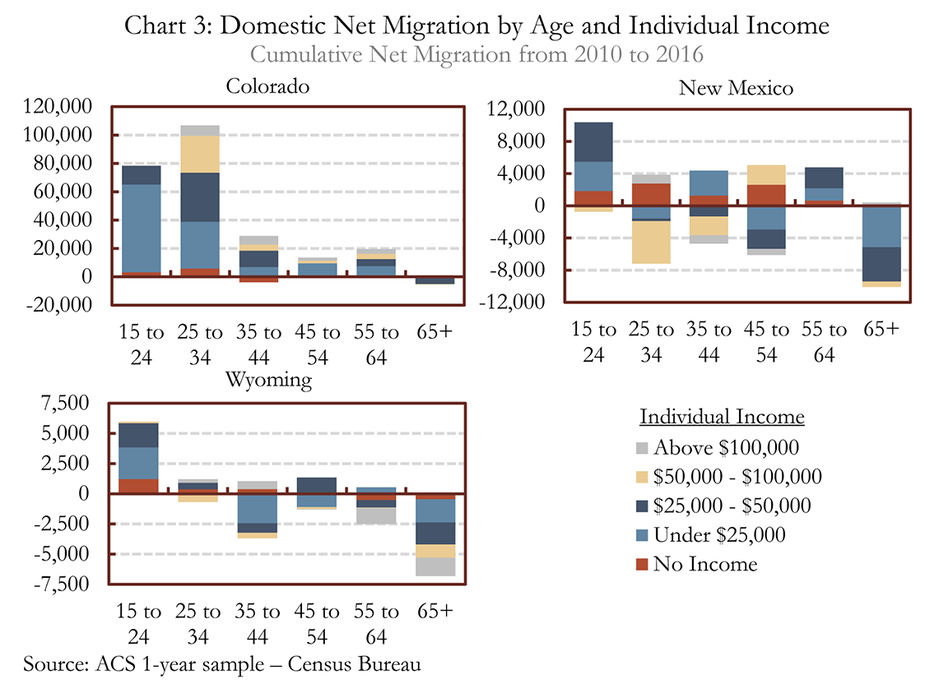
Migration patterns vary widely by age, with the youngest cohorts being the largest contributor to net inflows and the oldest cohort contributing the most to net outflows in the Rocky Mountain States (Chart 3). In Colorado, individuals ages 15 to 34 dominated net migration between 2010 and 2016, with 78 percent of total net migration in the state attributable to this age cohort. Net migration of individuals ages 35 to 64 also was positive in Colorado, while the state experienced a small net outflow of individuals 65 and older. Between 2010 and 2016, New Mexico and Wyoming each experienced overall negative net migration. In both states, individuals ages 15 to 24 provided the largest boost to net inflows, while those 65 and older provided the largest drag on net migration.
Migration by Income
Understanding the income levels of migrants can offer insights on the types of job opportunities that are attracting people to the region, the type and cost of housing that might be in high demand, and potentially the outlook for overall consumer spending. Colorado has had positive net migration across all income groups. However, almost half of all migrants that moved to Colorado between 2010 and 2016 earned less than $25,000. That said, income levels are skewed lower by the fact that most individuals moving to Colorado are young and therefore are in the early years of their working careers.
Among higher earners, Colorado experienced a higher level of net migration of individuals earning more than $100,000 than either New Mexico or Wyoming. In particular, a relatively large number of individuals 55 and older and who earned more than $100,000 left Wyoming between 2010 and 2016. In New Mexico, individuals ages 25 to 44 and who earned between $50,000 and $100,000 accounted for a large share of outflows.
Migration by Education
The educational attainment of a region’s workforce plays an important role in regional economic growth and individual labor market outcomes. Furthermore, migrants entering and leaving a state can alter the educational attainment of each state’s overall labor force (Chart 4 and Chart 5).
Despite the young age of its net migrants, Colorado tends to attract highly educated individuals. Between 2010 and 2016, about half of net migrants to Colorado had a bachelor’s degree or higher and an additional 35 percent had some college or an associate degree. The educational attainment of individuals moving into Colorado tends to be higher than the overall educational attainment within the state. For example, almost 33 percent of all Colorado residents older than 15 who did not move in a given year have a bachelor’s degree or higher compared with almost half of migrants to Colorado. Therefore, individuals moving to Colorado typically raise the overall educational attainment within the state.
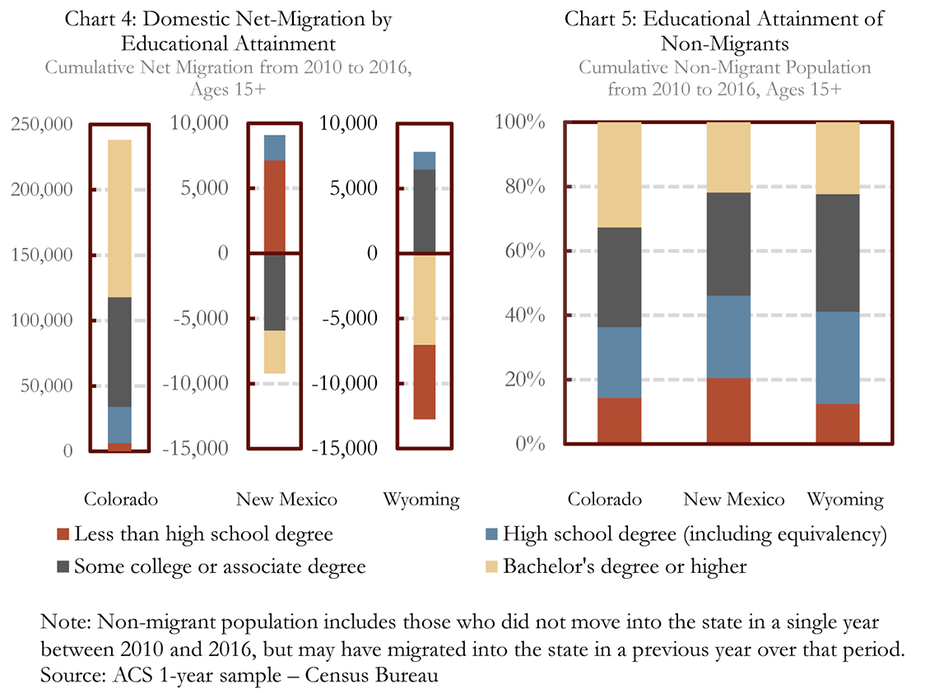
Between 2010 and 2016, New Mexico experienced a net outflow of those with higher levels of education and a net inflow of less-educated individuals. Specifically, those with some college or higher left the state on net, while those with a high school degree or less entered.vii These trends have lowered the overall educational attainment in the state and has played some role in New Mexico’s relatively large share of those with less than a high school degree.
Wyoming’s net domestic migration from 2010 to 2016 was mixed across educational cohorts. In particular, the state experienced a large outflow of individuals with a bachelor’s degree or higher, although it also experienced a net outflow of those with less than a high school degree. Individuals with some college or an associate degree as well as those with a high school degree, however, experienced net positive migration into the state. Those with some college or an associate degree are the largest educational cohort entering the state as well as the largest cohort within the state’s resident population at almost 37 percent, much larger than this educational cohort’s share in Colorado and New Mexico.
Conclusion
Migration plays a key role in overall population growth in the Rocky Mountain States, and therefore, has implications for regional economic growth. Overall, Colorado has experienced strong inflows of migrants in recent years, boosting the state’s overall population growth. By contrast, New Mexico and Wyoming have experienced some outflow of individuals, leading to slower population growth. Examining the demographics of recent migrants shows that Colorado, New Mexico and Wyoming have experienced the largest inflows from younger cohorts and the largest outflows from older populations. Colorado has attracted a large inflow of highly educated individuals in recent years, while both New Mexico and Wyoming have experienced a net outflow of individuals with a bachelor’s degree or higher.
End notes
i. U.S. Census Bureau – Population and Housing Unit Estimates.
ii. Ibid.
iii. Ibid.
iv. Ibid.
v. Bernalillo County experienced a net outflow of domestic migrants from 2010 to 2017 of about 13,000, more than offsetting the almost 7,300 international migrants who moved into the county.
vi. Estimated migration values differ between Population and Housing Unit Estimates data and American Community Survey data. While American Community Survey estimates do not account for international migration, each of the Rocky Mountain States would receive a modest increase from international migrants based on data from Population and Housing Unit Estimates from the U.S. Census Bureau as provided by Haver Analytics.
vii. These opposing in- and out-migration groups of some college or higher and high school degree or lower have closely offset each other at about 9,000 each. These numbers come from the American Community Survey – 1 Year Sample Public Use Microdata and are different from the Population and Housing Unit Estimates. This is why net migration for New Mexico here is different from what is shown in Chart 1.