In recent years, the Federal Reserve tightened monetary policy at an unprecedentedly rapid pace to quell post-pandemic inflation. Since March 2022, the target federal funds rate—the Fed’s preferred policy lever—has increased 525 basis points. In response, market interest rates have broadly risen across the economy, leaving businesses’ borrowing costs higher than levels that prevailed before the pandemic. High borrowing costs can discourage businesses from future investment and may pose risks to weak firms with limited earnings.
Firms may be better equipped to weather higher borrowing costs if they are not already highly leveraged. Although non-financial firms issued a large amount of debt during the pandemic, their leverage has declined to near pre-pandemic levels. Chart 1 shows that net leverage ratios—defined as total debt less cash holdings divided by earnings before interest, taxes, depreciation, and amortization (EBITDA)—rose sharply during the pandemic, when earnings declined and debt issuance soared._ Since then, however, corporate leverage has declined as massive fiscal stimulus helped shore up firms’ balance sheets. More generally, Chart 1 shows that leverage tends to rise during recessions and decline in economic expansions, consistent with its current behavior. Notably, net leverage ratios have declined across the distribution in recent years, unlike the recovery in the early 2000s, when some firms saw significant leverage increases.
Chart 1: Net leverage ratios for non-financial firms have returned to pre-pandemic levels
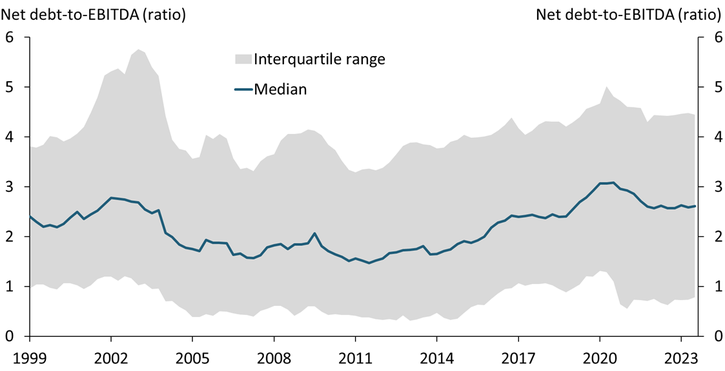
Note: Net leverage ratios are weighted by total assets.
Sources: S&P Global Compustat (accessed via Wharton Research Data Services) and authors’ calculations.
Although leverage and earnings have improved since the depths of the pandemic, firms have faced higher debt servicing costs as the Federal Reserve has tightened monetary policy. Chart 2 shows the distribution of interest coverage ratios (ICRs)—defined as EBITDA divided by interest expenses—at non-financial firms since 1999._ Higher values indicate firms are better positioned to meet their debt obligations. The median corporate ICR declined sharply in 2020 amid rapidly deteriorating economic conditions that delivered a sudden blow to business operations. However, ICRs began to recover in 2021:Q1 before peaking in 2022:Q3, reflecting rising earnings and the low interest rates that prevailed at the time. As the Federal Reserve started tightening monetary policy more recently, interest payments on debt increased, and ICRs have declined once again. In addition, the distribution has narrowed, with ICRs in the top quartile sliding toward their pre-pandemic levels.
Chart 2: Interest rate hikes have lowered interest coverage ratios
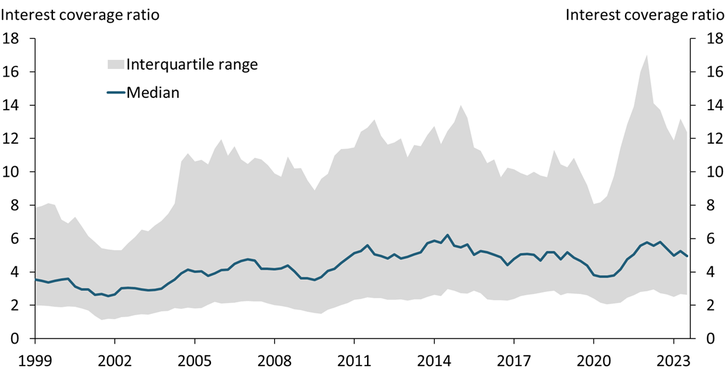
Note: ICRs are weighted by total assets.
Sources: S&P Global Compustat (accessed via Wharton Research Data Services) and authors’ calculations.
Although debt servicing costs have already increased, the Federal Reserve’s recent interest rate hikes are likely to continue to affect corporate debt in coming years. Although firms with floating-rate debt have already experienced the effect of higher interest rates, many firms issued low, fixed-rate debt during the pandemic and have not yet needed to refinance. When their debt matures, these firms, too, will face higher interest rates. To assess refinancing risks, we decompose corporate debt maturing in the next few years into fixed- and floating-rate instruments in Chart 3._ Consistent with increased debt issuance during the pandemic, we find that fixed-rate corporate debt (green bars) will increasingly mature over the next three years and will likely need to be refinanced at higher rates._
Chart 3: Interest payments may increase further, as a large amount of fixed-rate debt is expected to mature in the next few years
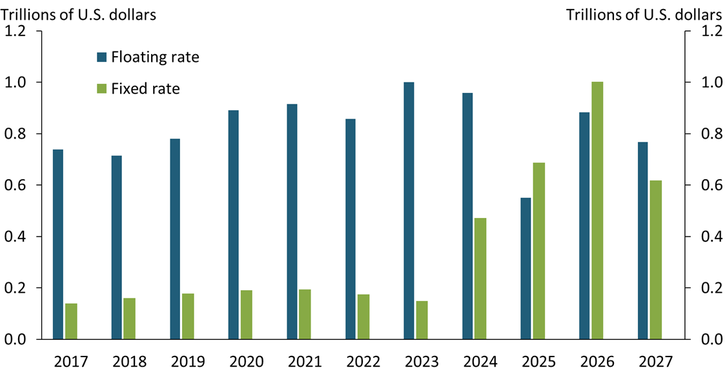
Sources: S&P Global Capital IQ Pro and authors’ calculations.
Making debt more expensive is an intended consequence of tightening monetary policy to contain inflation. Although the leverage ratio for non-financial firms remains at its pre-pandemic level, rapid increases in the federal funds rate have increased corporations’ interest payments. More importantly, the full effect of the Federal Reserve’s recent interest rate hikes on corporate bonds is likely yet to unfold: a large amount of fixed-rate debt will mature in the next few years, and firms may need to refinance some of this debt at a much higher interest rate. However, most firms have healthy interest coverage ratios, suggesting they can likely weather higher debt servicing costs as long as their earnings remain stable.
Endnotes
-
1
The large debt issuance was initially a precaution against rising economic risks and later a response to low interest rates induced by economic support policies (Acharya and Steffan 2020). Our Compustat sample is composed of U.S. firms with positive, non-missing assets. We drop financial, public administration, and unclassified firms. Financial ratios are derived from Wharton Research Data Services.
-
2
Following the Federal Reserve Board’s Financial Stability Report, we require interest expenses of at least $500,000 and debt-to-assets greater than 5 percent for firms in our ICR sample (Board of Governors of the Federal Reserve System 2023).
-
3
Data are drawn from S&P Global’s Capital IQ database. We collect all debt and loan facilities issued by non-financial, U.S firms excluding equity REITs. We drop all securities issued by firms with total assets less than $10 million. We consider bank loans as floating rate unless they are explicitly classified as fixed rate based on the discussion in Ippolito, Ozdagli, and Perez-Orive (2018).
-
4
Increased debt maturities in 2024 to 2027 are consistent with the Federal Reserve’s Financial Accounts release. Those data show that corporate bond issuance peaked between 2020 and 2021. Given typical original maturities of three to five years, we should expect increased maturities between 2024 and 2027.
References
Acharya, Viral V., and Sascha Steffan. 2020. “External LinkThe Risk of Being a Fallen Angel and the Corporate Dash for Cash in the Midst of COVID.” Review of Corporate Finance Studies, vol. 9, no. 3, pp. 430–471.
Board of Governors of the Federal Reserve System. 2023. “External LinkFinancial Stability Report.” October.
Ippolito, Filippo, Ali Ozdagli, and Ander Perez-Orive. 2018. “External LinkThe Transmission of Monetary Policy Through Bank Lending: The Floating Rate Channel.” Journal of Monetary Economics, vol. 95, pp. 49–71.
Huixin Bi is a research and policy officer, W. Blake Marsh is a senior economist, and Phillip An is a research associate at the Federal Reserve Bank of Kansas City. The views expressed are those of the authors and do not necessarily reflect the positions of the Federal Reserve Bank of Kansas City or the Federal Reserve System.