The number of individuals in the labor force with “some college”—a designation that captures those who completed some college credits but not a bachelor’s degree, those with a post-secondary non-degree certificate, and those with an associate degree—has fallen over the past few years. Chart 1 illustrates that while the size of the overall labor force (blue line) has recovered and surpassed its pre-pandemic level, the number of individuals in the labor force with some college education (green line) remains about 1.5 million below its pre-pandemic level.
Chart 1: Size of the overall labor force has surpassed its pre-pandemic level but contains 1.5 million fewer individuals with some college education
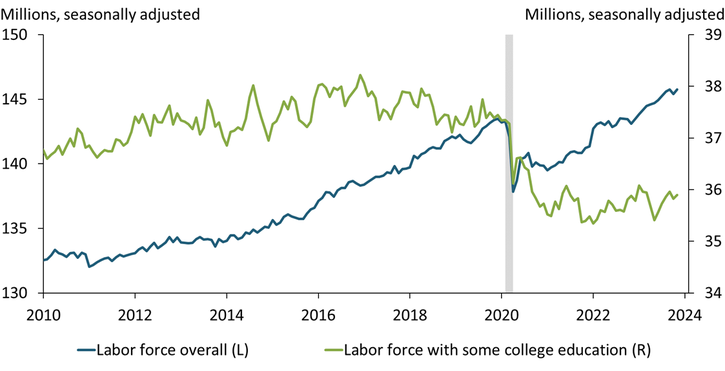
Notes: Both series are restricted to individuals in the labor force age 25 and above. Gray shaded area denotes National Bureau of Economic Research (NBER)-defined recession.
Sources: U.S. Bureau of Labor Statistics and NBER (both accessed through Haver Analytics).
This drop in individuals with some college education is due to both an especially high rate of retirement in this education group and fewer young people with this level of education entering the labor force. Chart 2 shows that since February 2020, the number of retired individuals with some college education (solid blue line) has increased by more than one million. Although this increase is in line with its pre-pandemic trend (dashed blue line), it constitutes the largest increase in the share of retired individuals of any educational group over this period. Compounding these retirements is a contraction of the number of younger individuals with some college in the labor force. Since February 2020, the number of people age 25 to 34 with some college in the labor force has fallen by almost 900,000 (solid green line). Notably, this number is well below its pre-pandemic trend (dashed green line). Although the total number of people in the labor force age 25 to 34 also decreased over this period, the drop was much smaller at only 100,000 workers. Instead, the decline in the size of the “some college” labor force is mostly attributable to a shift in educational attainment, with the drop being offset by a growing number of younger adults in the labor force with a bachelor’s degree or higher.
Chart 2: Among individuals with some college education, the number of retired individuals has increased, while the number of younger individuals in the labor force has decreased
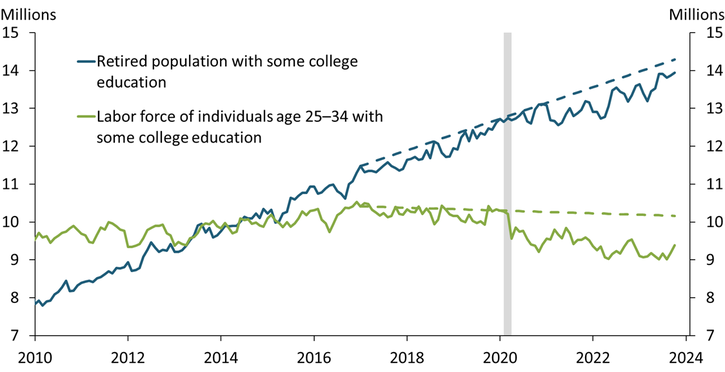
Notes: Gray shaded area denotes NBER-defined recession. Dashed lines denote the 2017–19 trend.
Sources: U.S. Census Bureau, NBER (Haver Analytics), and author’s calculations.
This decline in the number of individuals in the labor force with some college education has elevated vacancies for jobs that require a non-degree certificate or associate degree. The left panel of Chart 3 shows the number of job postings by minimum education required._ Job postings across educational groups moved together pre-pandemic and subsequently peaked in mid-2022. However, job postings requiring an associate degree (purple line) or non-degree certificate (orange line) had the highest peaks. Moreover, while vacancies for most groups have dropped substantially since 2022, the number of job postings requiring some college education remains 60 percent above its pre-pandemic level.
Chart 3: Job postings requiring some college education are highly elevated, particularly in the healthcare field
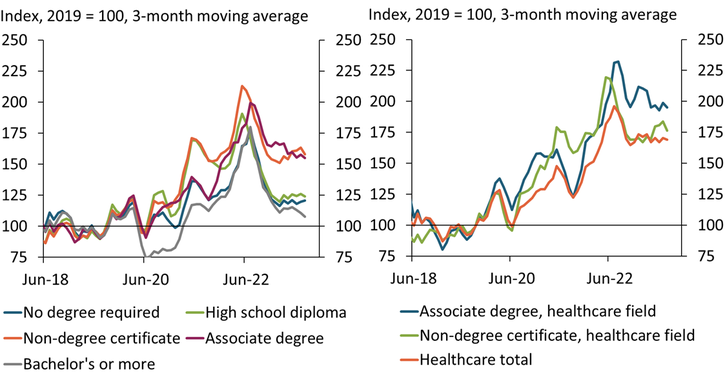
Sources: Lightcast and author’s calculations.
These vacancies for jobs requiring some college education are concentrated in healthcare occupations, leading healthcare employers to turn to more educated workers to fill positions._ As of August 2023, about 50 percent of all vacancies posted in 2023 that required an associate degree or non-degree certificate were in a healthcare occupation. The right panel of Chart 3 shows that healthcare job postings that require an associate degree (blue line) or non-degree certificate (green line) are elevated relative to 2019. In fact, associate degree job postings in healthcare are about double what they were in 2019. Employment data from the Current Population Survey (CPS) on workers age 25 and above suggest that employers have turned to higher-educated workers to fill these openings. While healthcare employment among workers with some college education has dropped by about 400,000 since 2019, healthcare employment among workers with a bachelor’s degree or more has increased by 600,000.
The vacancies and employment data suggest that the lack of workers with some college education may be putting upward pressure on wages in the healthcare field. First, the vacancies data suggest that while employers have strong demand for workers with this level of education, the supply of these workers is limited. Consequently, employers may be forced to offer higher wages in hopes of attracting qualified workers. Second, the employment data suggest that employers have turned to workers with more education to fill these open positions. More highly educated workers are generally more expensive; thus, as employers shift to these workers, the average wage in these occupations is likely to increase.
Indeed, data from the CPS suggest both increased wages within educational groups and composition effects contributed to high wage growth in healthcare occupations. The blue bar in Chart 4 shows that overall wages for healthcare workers rose by 24.6 percent from 2019 to 2023. The green bars in Chart 4 show that much of this increase is due to wage increases within educational groups. For example, holding the share of workers with some college education constant, increased wages for workers with some college contributed 4.7 percentage points to the total increase. However, the changing composition of the workforce also contributed to wage increases. The orange bar shows that the shift in employment toward higher-educated workers accounts for an additional 2.7 percentage points of the total wage increase.
Chart 4: Wages in healthcare jobs have risen nearly 25 percent from 2019 to 2023 due to both higher wages and changes in the educational composition of the workforce
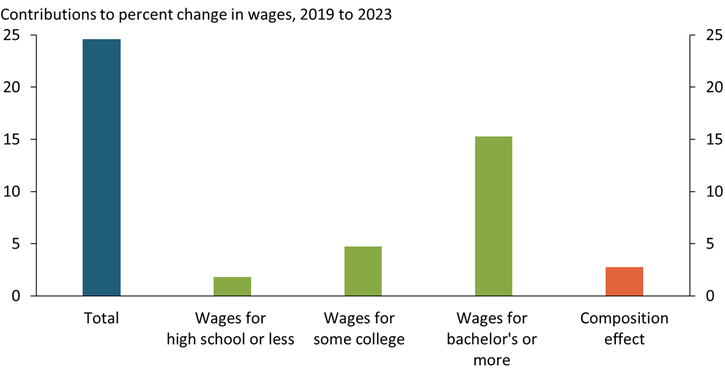
Note: Calculation includes only employed workers age 25 and above.
Sources: U.S. Census Bureau and author’s calculations.
Labor tightness in healthcare occupations is unlikely to unwind quickly. As Chart 2 shows, the increased retirements among workers with some college education were part of a long-term trend rather than a pandemic anomaly and are thus unlikely to reverse. According to the Digest of Education Statistics published by the National Center for Education Statistics, degrees conferred in healthcare-related associate degree programs and non-degree certificate programs have been on the decline since the 2010–11 school year, suggesting the number of young workers is unlikely to increase substantially. Additionally, projections from the Bureau of Labor Statistics suggest that employment in healthcare occupations will continue to increase and at a faster pace than almost all other occupational groups (Colato and Ice 2023). Thus, it may take some time to rebalance this segment of the labor market.
Download Materials
Endnotes
-
1
Lightcast job posting data include all certifications for all levels of education. For example, a job posting for a lawyer requires both an advanced degree and a certification from that state’s bar association. To more closely match the BLS data, I define a job posting requiring a post-secondary non-degree certificate as a job posting that requires a high school diploma, but no higher, and a certification other than a standard driver’s license.
-
2
I define healthcare occupations to include Standard Occupational Classification (SOC) occupational groups “Healthcare Support Occupations” and “Healthcare Practitioners and Technical Occupations.”
Reference
Colato, Javier, and Lindsey Ice. 2023. “External LinkIndustry and Occupational Employment Projections Overview and Highlights, 2022–32.” U.S. Bureau of Labor Statistics, Monthly Labor Review, October.
Emily Pollard is an assistant economist at the Federal Reserve Bank of Kansas City. The views expressed are those of the author and do not necessarily reflect the positions of the Federal Reserve Bank of Kansas City or the Federal Reserve System.