State and local governments make sizeable contributions to the growth of the U.S. economy. State and local spending accounts for two-thirds of overall government spending. In addition, state governments hold unemployment insurance funds that provide a cyclical buffer to households and support private consumption during economic downturns.
State governments can tap into both rainy day funds and unemployment insurance funds during recessions to stabilize economic conditions. However, the two types of reserve funds affect different sectors of the economy. Rainy day funds support state and local spending and are vital to maintaining state budget health; states use these funds to manage budgetary uncertainty and cope with unforeseen changes in general expenditures and revenues. In contrast, unemployment insurance funds support private spending by providing an important income source for households during economic downturns.
The overall rainy day fund balance reached its highest level since 2000 in fiscal year 2017._ Chart 1 shows that both the median and GDP-weighted average of rainy day fund balances, measured as the number of days of government operations the funds would cover, increased for a seventh straight year in fiscal year 2017. The median fund balance was sufficient to cover government operations for 20 days in fiscal year 2017 compared with the pre-recession peak of 16 days in fiscal year 2008.
Chart 1: State Rainy Day Funds in Terms of Days of Covered General Fund Expenditures
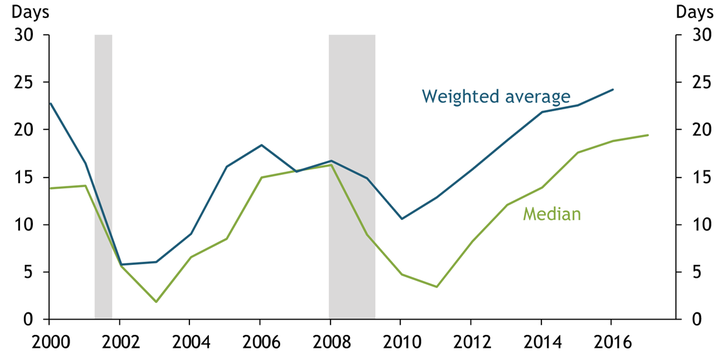
Note: For the weighted average measure, more weight is given to states with higher GDP. Gray bars denote National Bureau of Economic Research (NBER)-defined recessions.
Sources: Pew Charitable Trusts, NBER, U.S. Census Bureau (Haver Analytics), and authors’ calculations.
Comparing the median and weighted average balance shows that the overall improvement in rainy day funds was to a larger extent driven by large states that make higher contributions to overall state and local spending. Specifically, the weighted average balance, which gives more weight to states with higher GDP, has increased more rapidly than the median fund balance since fiscal year 2009._ California, which accounts for 14 percent of national GDP, had a rainy day fund balance sufficient to cover 31 days of general fund expenditures in fiscal year 2017, significantly higher than the national median of 20 days. Texas had an even larger rainy day fund balance that could cover 70 days’ worth of general fund expenditures. In contrast, smaller states with lower GDP such as Pennsylvania and New Jersey had a zero balance in their rainy day funds for eight straight years from fiscal year 2010 to 2017. Since larger states make bigger contributions to overall state and local spending, the weighted average measure is more informative about the capacity of rainy day funds to stabilize overall state and local spending during recessions.
Unemployment insurance funds have also recovered from the recent recession, as shown in Chart 2. The median and GDP-weighted average reserve ratios for unemployment insurance funds, measured as the ratio of net reserves divided by total wages paid in covered employment, have been increasing since fiscal year 2010. Both measures surpassed their 2007 levels in fiscal year 2017, although they remained significantly lower than their levels in the early 2000s.
Chart 2: Reserve Ratio of State Unemployment Insurance Funds
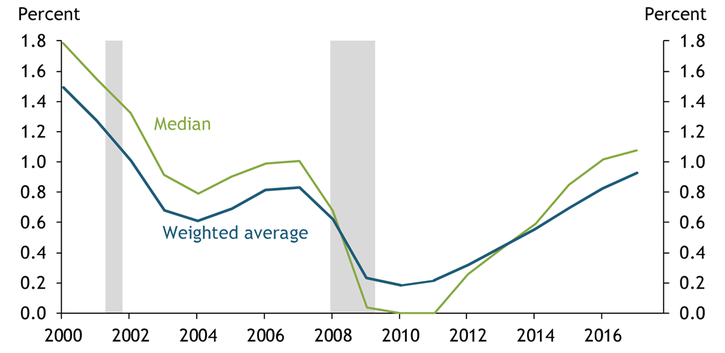
Notes: For the weighted average measure, more weight is given to states with higher GDP. Gray bars denote NBER-defined recessions.
Source: U.S. Department of Labor (Haver Analytics), U.S. Census Bureau (Haver Analytics), and authors’ calculations.
Interestingly, small states appear to have driven the recent improvement in unemployment insurance funds since fiscal year 2013. Oregon had the highest reserve ratio of 5.4 in fiscal year 2017, significantly higher than the national median of slightly above 1. Excluding energy states such as Wyoming and Alaska, Washington had the second highest reserve ratio of 2.8.
In contrast, California has had negative net reserves in its unemployment insurance fund since fiscal year 2009 and has had to rely on federal loans to fill the gaps between unemployment insurance receipts and expenses._ New York faced identical challenges between fiscal years 2009 and 2014. The slow recovery of unemployment insurance funds in large states is particularly striking against the backdrop of persistent improvement in the labor market. Claims on unemployment benefits have been trending down since 2009 and reached a level close to their historical low in 2018. Yet large states are not well positioned to provide a cyclical buffer to households in the event of a downturn.
To summarize, rainy day and unemployment insurance funds have largely recovered since the Great Recession but at an uneven pace across states. Bigger states have accumulated larger rainy day fund reserves but are lagging behind in improving their unemployment insurance funds. More robust unemployment insurance funds in smaller states are unlikely to make up the difference in the event of a downturn. As a result, state governments overall may be able to provide less of a cyclical buffer to households than they are able to provide for their own budgets.
Endnotes
-
1
State total balances, including budget ending balances and the amounts in stabilization or rainy day funds, have also improved since 2009 but fallen slightly below their pre-recession levels.
-
2
A different weighting scheme does not change the comparison results. For instance, when giving more weight to states with higher general expenditures, the new weighted average balance is very similar to the GDP-weighted average.
-
3
The Department of Labor does not differentiate between states with negative versus zero net reserves. States with negative net reserves have zero reserve ratios in the data.
Huixin Bi is a senior economist at the Federal Reserve Bank of Kansas City. Jaeheung Bae is a research associate at the bank. The views expressed are those of the authors and do not necessarily reflect the positions of the Federal Reserve Bank of Kansas City or the Federal Reserve System.