Although U.S. imports likely contributed to foreign inflation early in the pandemic, this influence has likely faded recently. Chart 1 shows that during the early stages of the COVID-19 pandemic, U.S. consumers shifted their spending away from contact-intensive services (green line), which are usually produced domestically, and toward goods (blue line), many of which are imported from abroad._ Although increased demand for foreign goods does not typically drive up prices much on its own, the increase in demand coincided with rising global supply constraints (orange line). Together, these factors likely put pressure on foreign inflation early in the pandemic (Fornaro and Romei 2022; Holland and others 2022). However, over the last few months, the gap between services and goods consumption has been narrowing and supply chain pressures have eased. Therefore, the U.S. import channel could moderate as a driver of foreign inflation.
Chart 1: The gap between spending on goods and services has narrowed as supply bottlenecks ease
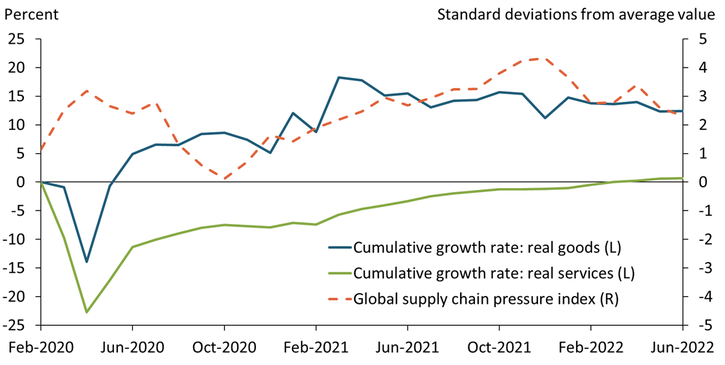
Note: Chart plots the cumulative growth rate of services and goods consumption (adjusted for inflation) relative to February 2020 and the New York Fed Global Supply Chain Pressure Index (GSCPI).
Sources: U.S. Bureau of Economic Analysis (BEA), Federal Reserve Bank of New York, and authors’ calculations.
Instead, U.S. export prices may now be contributing to foreign inflation. Over the last year, U.S. export prices in foreign currency (excluding food and energy) increased by 11.8 percent, far exceeding the historical average of 3.75 percent. Two factors contribute to the increase in export prices: price pressures for U.S. exporters and appreciation in the U.S. dollar. First, increased costs drive U.S. exporters to set higher prices for their goods. These price pressures originate in the United States (for example, wage pressures and domestic supply chain disruptions) and in global markets (for example, energy and commodities prices). Second, appreciation in the U.S. dollar makes exports more costly for foreign buyers, as the United States invoices most of its exports in U.S. dollars.
To account for these two factors, Chart 2 decomposes export price growth in foreign currency (excluding food and energy) into the contribution from U.S. exporters (green bars) and a trade-weighted exchange rate (blue bars), which translates U.S. dollar prices into foreign currency from 2012:Q1 through 2022:Q2._ The sum of both bars represents the total increase in U.S. export prices in foreign currency (dashed black line). Over the last year, price pressures for U.S. exporters increased the dollar price of exports (green bar) by about 5.0 percent, while the U.S. dollar (blue bar) appreciated by 6.8 percent. Therefore, approximately 42 percent of the increase in U.S. export prices in foreign currency is due to price pressures for U.S. exporters, while the remaining 58 percent is due to appreciation in the U.S. dollar. Combined, both factors far exceed foreign trade-weighted CPI inflation of about 4.3 percent annualized (orange line) and the historical average of export price inflation of 3.75 percent, suggesting that the United States exerts sizable pressures on foreign inflation.
Chart 2: Rising U.S. export prices contribute to foreign inflation
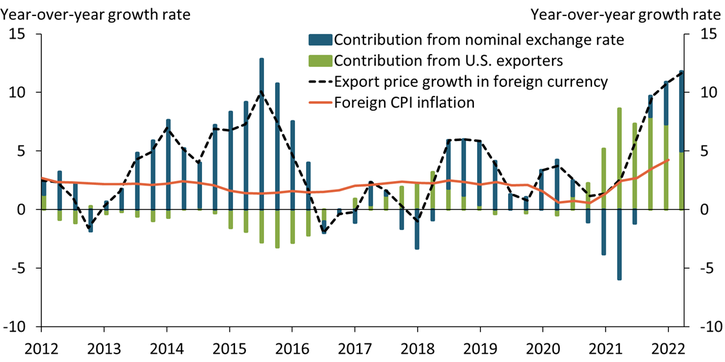
Sources: U.S. Bureau of Labor Statistics (BLS), International Monetary Fund, Organisation for Economic Co-operation and Development, World Bank, Foreign Central Banks and Statistical Agencies, Bloomberg, Pacific Exchange Rate Service, and authors’ calculations.
The chart also shows that the current increase in U.S. export prices in foreign currency looks similar to the rise in export prices during 2013–15, though the contributions from U.S. exporters and exchange rate fluctuations differ remarkably between the two periods. During 2013–15, U.S. inflation was low, while the U.S. dollar appreciated by roughly 25 percent. Thus, the increase in export prices was entirely due to the appreciation of the U.S. dollar. In contrast, the recent hike in export prices has been due to both appreciation in the U.S. dollar and a rise in the dollar price of U.S. exports.
To illustrate the effect across countries, Chart 3 compares inflationary pressures from U.S. exports from 2021:Q2–2022:Q2 relative to a historical pre-pandemic average for six selected regions: Canada, Chile, Singapore, Mexico, the euro area, and Brazil. In particular, the chart shows the contribution of U.S. exports to foreign inflation calculated as the rise in U.S. export prices in a foreign currency multiplied by the relevant country’s consumption share of U.S. goods and services._ The green bars show that apart from Brazil, all regions have been subject to elevated U.S. inflationary pressures over the past year. The contribution from U.S. exports to Canadian inflation has been particularly large, rising from 0.55 percentage points historically to 1.42 percentage points more recently. Although U.S. exports are only valued at 2.95 percent of overall GDP in the euro area, the contribution from U.S. exports to euro inflation has ticked up from 0.06 to 0.47 percentage points, largely due to the weak euro. In contrast, U.S. exports make up a greater share of Mexican consumption; however, the Mexican peso has been relatively stable recently, leading U.S. export prices to have a smaller effect on Mexican inflation over the past year than in the pre-pandemic period. The Brazilian real is also relatively strong, explaining why Brazil is not currently experiencing inflationary pressures from U.S. exports. Overall, U.S. export price pressures have increased, which enhances inflationary pressures particularly for countries that are heavily exposed to the United States and are subject to a weak currency (for example, Canada, Singapore, and Chile).
Chart 3: U.S. exports induce inflationary pressures abroad relative to historical benchmark
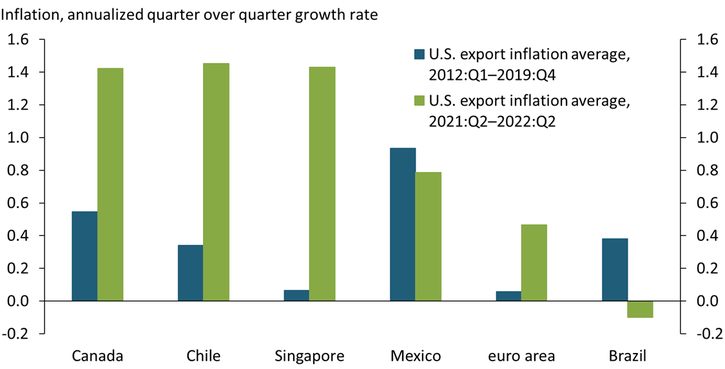
Sources: BLS, Pacific Exchange Rate Service, and authors’ calculations.
Our analysis emphasizes the role of U.S. exports in driving foreign inflation. Our findings suggest that U.S. export prices currently have a sizable influence on foreign inflation due to higher costs for U.S. exporters, which primarily affects countries with a large import share of goods and services from the United States and that face a weak currency. However, U.S. inflationary pressures have eased in July, and the U.S. dollar recently trended downward. If both factors continue to moderate, U.S. exports may have a smaller effect on foreign inflation in the upcoming months.
Download Materials
Endnotes
-
1
The value of imported goods is equivalent to roughly 15 percent of U.S. GDP.
-
2
The U.S. dollar exchange rate is trade-weighted against 26 foreign currencies and is therefore more representative than bilateral exchange rates.
-
3
We make two assumptions due to the lack of more granular data: First, as a proxy for the consumption share of U.S. goods and services in country j, we use exports from the United States to country j in U.S. dollars divided by the GDP of country j in U.S. dollars. We calculate this ratio for the year 2021. Second, we assume that export prices rise by the same amount for all countries.
References
Fornaro, Luca, and Federica Romei. 2022. “External LinkMonetary Policy during Unbalanced Global Recoveries.” Centre for Economic Policy Research, Discussion Paper no. 16971.
Holland, Ben, Alexander Weber, and Enda Curran. 2022. “External LinkThe U.S. Is Exporting Inflation, and Fed Hikes Will Make It Worse.” Bloomberg, July 17.
Johannes Matschke is an economist at the Federal Reserve Bank of Kansas City. Sai A. Sattiraju is a research associate at the bank. The views expressed are those of the authors and do not necessarily reflect the positions of the Federal Reserve Bank of Kansas City or the Federal Reserve System.