Agricultural debt at commercial banks continued to decline in the first quarter of 2021 and farm loan performance improved. Both real estate and production loans decreased, reducing farm debt by more than 5% from a year ago and contributing to a decline in the number of banks classified as agricultural banks. The reduction in agricultural loan balances was less pronounced among banks most concentrated in agriculture, driven by modest growth in real estate debt among those lenders. Delinquency rates on farm debt dropped notably from a year ago and, alongside strong earnings, profitability at agricultural banks improved from the end of last year.

The outlook for agriculture remained strong heading into the summer months. Robust demand for key farm commodities continued to support strong prices and optimism across the sector. Increases in production costs and persistent drought in many regions lingered as concerns, however; and profitability for cattle producers remained narrow. Overall, strength in aggregate conditions and lasting support of government aid and lending programs have continued to limit increases in farm debt and ease agricultural credit stress.

First Quarter Commercial Bank Call Report Data

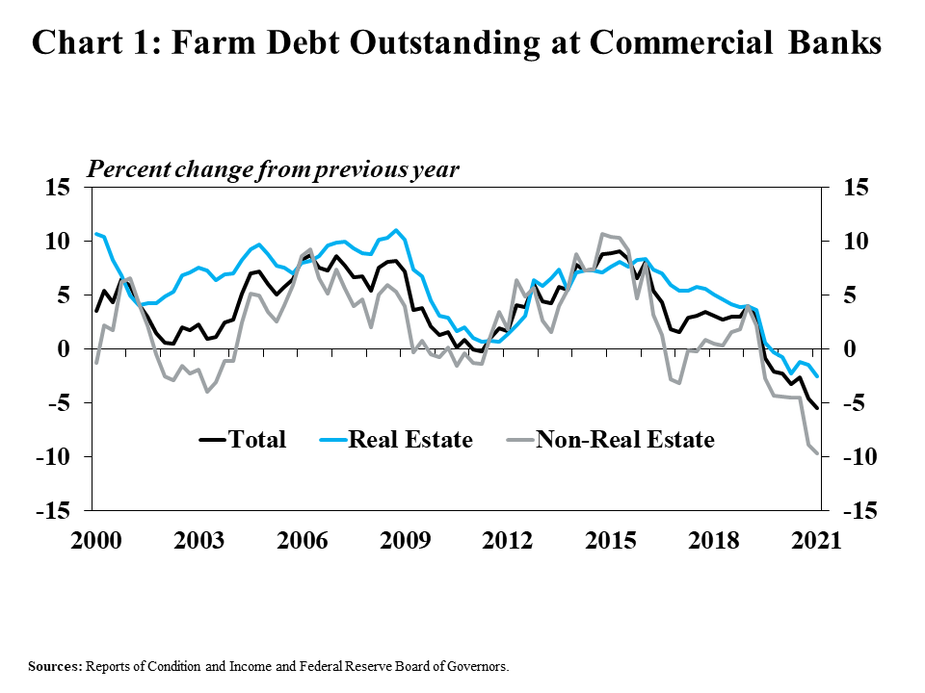
Farm debt at commercial banks continued to shrink in the first quarter. Non-real estate farm debt decreased by 10% from a year ago as strong profits in large segments of the agricultural sector limited producers’ needs for operating loans (Chart 1). Similarly, farm real estate debt declined by 3% from a year ago despite ongoing increases in the valuations of farm real estate.

Chart 1: Farm Debt Outstanding at Commercial Banks, is a line graph showing the percent change in farm debt outstanding from the previous year in every quarter from 2000 to 2021. It includes a line for total farm debt, farm real estate debt and non-real estate farm debt.   Sources: Reports of Condition and Income and Federal Reserve Board of Governors.

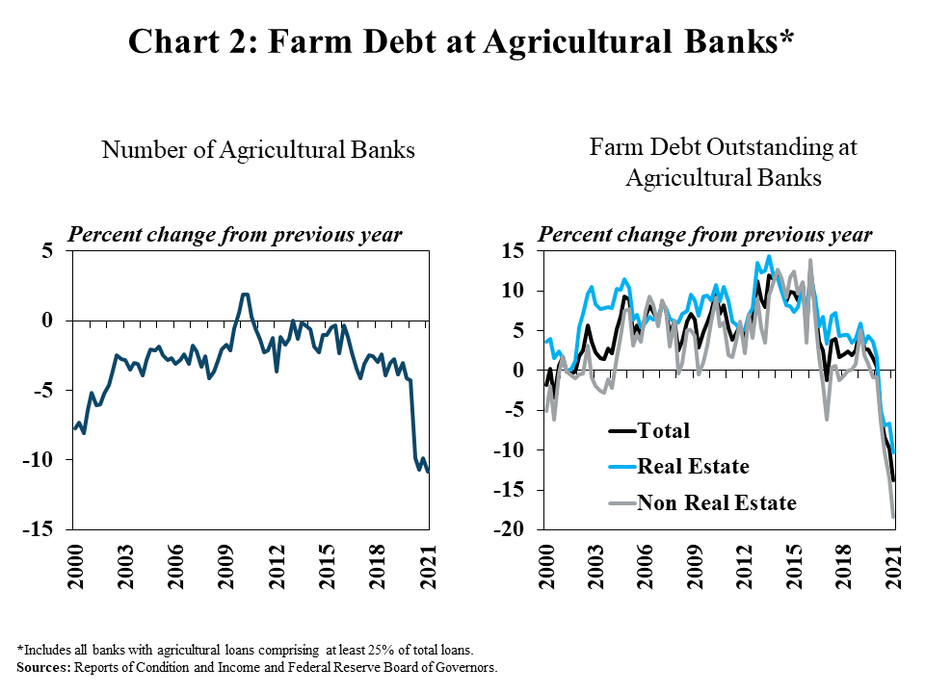
Alongside the consistent declines in farm lending over the past year, the number of banks with concentrations in farm lending has decreased notably. From 2010 to 2019, the number of banks classified as agricultural banks decreased at an annual pace of about 2%. Since early 2020, however, the number of commercial banks meeting the criteria to be considered an agricultural bank has dropped by an average of more than 10% (Chart 2, left). With a smaller number of banks highly concentrated in agriculture, the amount of farm debt held at agricultural banks has dropped considerably when compared with a year ago (Chart 2, right).

Chart 2: : Farm Debt at Agricultural Banks*, includes two individual charts. Left, Number of Agricultural Banks, is a line graph showing the percent change in the number of agricultural banks in every quarter from 2000 to 2021. Right, Farm Debt Outstanding at Agricultural Banks, is a line graph showing the percent change in farm debt outstanding at agricultural banks from the previous year in every quarter from 2000 to 2021. It includes a line for total farm debt, farm real estate debt and non-real estate farm debt.  *Includes all banks with agricultural loans comprising at least 25% of total loans.  Sources: Reports of Condition and Income and Federal Reserve Board of Governors.

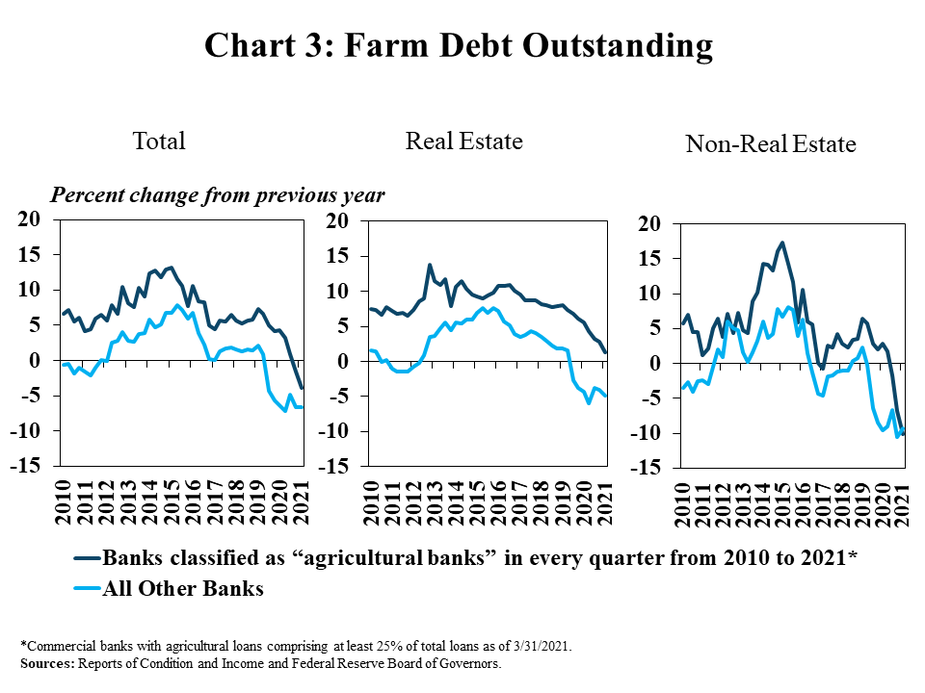
Among lenders that have remained highly concentrated in agriculture, the pullback in farm debt in recent quarters has been less pronounced. For banks that retained their classification as an agricultural bank through the first quarter of 2021, farm debt was about 3% less than a year ago. In contrast, farm debt decreased by nearly 7% at other banks not classified as an agricultural bank in the first quarter (Chart 3, left). Moreover, farm real estate debt increased slightly at banks retaining their agricultural classification while real estate lending at other banks declined by 5% (Chart 3, middle). Non-real estate farm loan balances dropped by about 10% at all commercial banks, regardless of their classification as agricultural or non-agricultural (Chart 3, right).

Chart 3: Farm Debt Outstanding, includes three individual charts. Left, Total, is a line graph showing the showing the percent change in total farm debt from the previous year in every quarter from 2010 to 2021. Middle, Real Estate, is a line graph showing the showing the percent change in total farm real estate debt from the previous year in every quarter from 2010 to 2021. Right, Non-Real Estate, is a line graph showing the showing the percent change in non-real estate farm debt from the previous year in every quarter from 2010 to 2021. All three charts include lines for Banks classified as “agricultural banks” in every quarter from 2010 to 2021* and All Other Banks.   *Commercial banks with agricultural loans comprising at least 25% of total loans as of 3/31/2021. Source: Reports of Condition and Income and Federal Reserve Board of Governors.

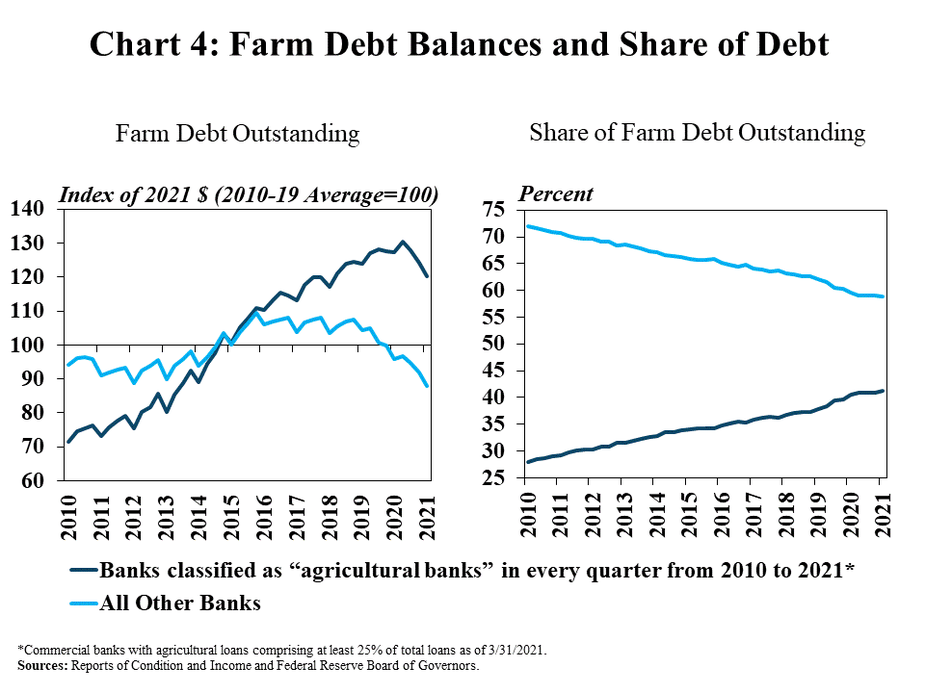
The level of farm debt also remained elevated among the most concentrated farm lenders but reached a ten year low among other banks. Farm loan balances remained about 20% above the ten-year average for banks classified as agricultural banks in every quarter since 2010 but were more than 10% below that average among all other banks (Chart 4). With substantial growth in farm debt at banks consistently meeting the criteria to be considered an agricultural bank, the share of farm loan balances held by those lenders has increased steadily.

Chart 4: Farm Debt Balances and Share of Debt, includes two individual charts. Left, Farm Debt Outstanding, is a line graph showing the level of farm debt at Banks classified as “agricultural banks” in every quarter from 2010 to 2021* and All Other Banks as an index of 2021 dollars (2010 Average = 100) in every quarter from 2010 to 2021. Right, Share of Farm Debt Outstanding, is a line graph showing the percent of farm debt held at Banks classified as “agricultural banks” in every quarter from 2010 to 2021* and All Other Banks in every quarter from 2010 to 2021.   *Commercial banks with agricultural loans comprising at least 25% of total loans as of 3/31/2021. Source: Reports of Condition and Income and Federal Reserve Board of Governors.

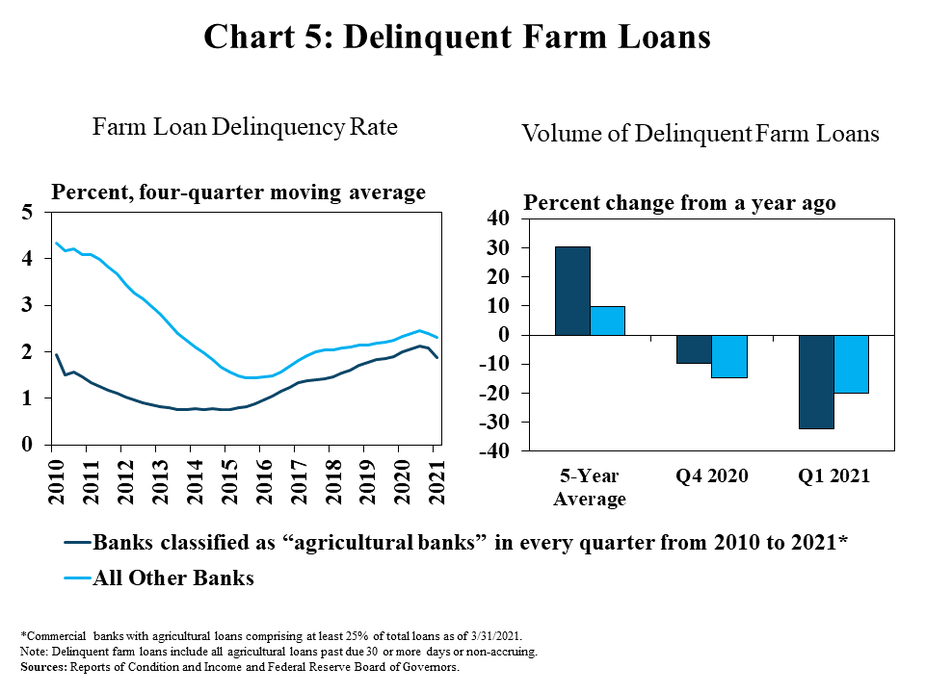
Alongside reduced levels of farm debt in aggregate, the volume of delinquent loans declined substantially in the first quarter. The volume of delinquent farm loans was about 25% less than a year ago at commercial banks and the rate of delinquencies also edged lower. Delinquent loan volumes decreased more substantially at banks most concentrated in agriculture and the rate of delinquency among those lenders also remained slightly less than at other banks (Chart 5).

Chart 5: Delinquent Farm Loans, includes two individual charts. Left, Farm Loan Delinquency Rate, is a line graph showing farm loan delinquency rate in percent at Banks classified as “agricultural banks” in every quarter from 2010 to 2021* and All Other Banks in every quarter from 2010 to 2021. Right, Volume of Delinquent Farm Loans, is a clustered column chart showing the percent change in the volume of delinquent farm loans at Banks classified as “agricultural banks” in every quarter from 2010 to 2021* and All Other Banks. The vertical axis is the percent change from a year ago and the horizontal axis includes the 5-Year average , Q4 2020 and Q1 2021.   *Commercial banks with agricultural loans comprising at least 25% of total loans as of 3/31/2021.  Note: Delinquent farm loans include all agricultural loans past due 30 or more days or non-accruing.  Sources: Reports of Condition and Income and Federal Reserve Board of Governors.

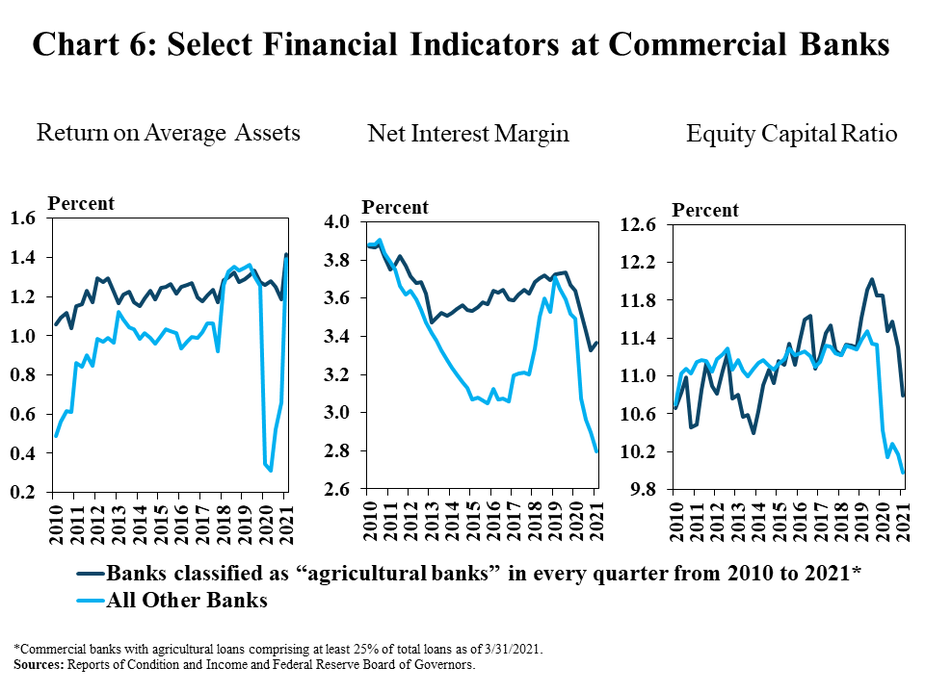
In addition to improvement in the performance of farm loans, profitability at agricultural banks strengthened considerably. After declining at the end of 2020, and despite net interest margins remaining narrow, the return on assets at agricultural banks rebounded alongside strong growth in non-interest income and lower expenses (Chart 6). Consistent with broader trends, the amount of capital at agricultural banks grew alongside strong earnings, but growth in total assets resulting from large deposit balances put downward pressure on capital ratios.

Chart 6: Farm Debt Outstanding, includes three individual charts. Left, Return on Average Assets, is a line graph showing the showing the return on average assets as a percent in every quarter from 2010 to 2021. Middle, Net Interest Margin, is a line graph showing the net interest margin as a percent in every quarter from 2010 to 2021. Right, Equity Capital Ratio, is a line graph showing the showing the equity capital ratio as a percent in every quarter from 2010 to 2021. All three charts include lines for Banks classified as “agricultural banks” in every quarter from 2010 to 2021* and All Other Banks.   *Commercial banks with agricultural loans comprising at least 25% of total loans as of 3/31/2021. Source: Reports of Condition and Income and Federal Reserve Board of Governors.

Data and Information

Excel SpreadsheetCommercial Bank Call Report Historical Data

Excel SpreadsheetAg-Finance-Commercial-Bank-Call-Report-Data-Tables

txtAbout the Commercial Bank Call Report Data

Authors

Nate Kauffman

Senior Vice President, Economist, and Omaha Branch Executive

Nate Kauffman is Senior Vice President and Omaha Branch Executive at the Federal Reserve Bank of Kansas City. In his role as the Kansas City Fed's lead economist and represe…

Ty Kreitman

Associate Economist

Ty Kreitman is an associate economist in the Regional Affairs Department at the Omaha Branch of the Federal Reserve Bank of Kansas City. In this role, he primarily supports the F…