After falling sharply during the 2007-09 recession, residential construction and real estate activity has steadily improved. However, in late 2018 and early 2019, several indicators started to show that residential activity was slowing at the national level, including declines in single-family permitting and home sales and a slower pace of home price appreciation. This issue of the Rocky Mountain Economist examines residential construction and real estate conditions in Colorado, New Mexico and Wyoming, and assesses how activity levels today compare with pre-recession levels.
The Cyclicality of Residential Construction
Historically, residential construction has risen and fallen along with the strength of the overall economy (Chart 1). When the economy is expanding, building activity tends to rise, as seen by a steady increase in housing permits issued during the expansion of the mid-1980s, the mid-to-late 1990s and early-to-mid-2000s. However, construction can also slow sharply when the economy experiences a downturn. For example, residential building permitting slowed during the early 1980s recession, the early 1990s recession and again in the early 2000s. The decline in residential construction was particularly severe during the most recent recession. Annual single-family housing permits fell 81, 74 and 55 percent in Colorado, New Mexico and Wyoming, respectively, between their pre-recession highs in 2005 to their post-recession troughs.i
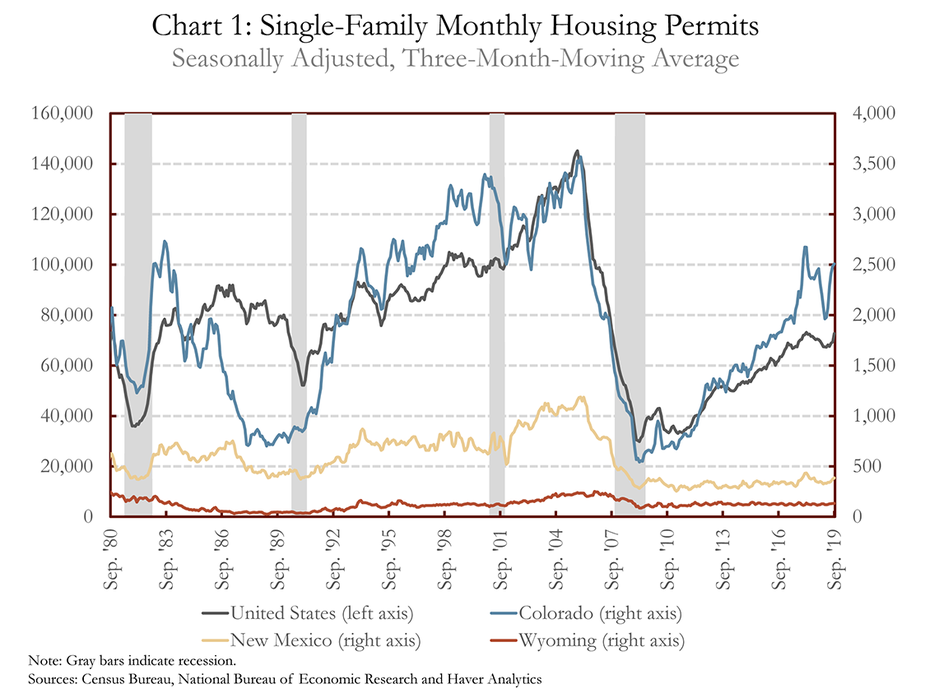
The United States and Colorado have experienced sizable gains in single-family permitting since the end of the 2007-09 recession, while gains in New Mexico and Wyoming have been more modest. But although single-family permits have increased in each area since the end of the Great Recession, the number of permits issued annually still remains well below previous peak levels. Nationally, 854,241 single-family permits were issued in 2018, 49 percent less than in 2005. Similarly, the number of single-family permits issued in 2018 in Colorado, New Mexico and Wyoming were 28, 66 and 44 percent below previous peak levels, respectively.
Looking at activity over the past year, single-family permitting started to slow in the second half of 2018 and remained somewhat sluggish in early 2019 in the United States, Colorado and New Mexico. For each of the Rocky Mountain States, single-family permitting generally has been lower year-to-date through September 2019 compared with the same period in 2018. Single-family permits have declined 3.4, 9.1 and 8.8 percent in the United States, Colorado and New Mexico, respectively, while Wyoming permits are up just 1.1 percent.ii In recent months, however, single-family permits have risen in New Mexico and Wyoming, with permits issued in September well above year-ago levels. Colorado permits in September 2019 are down slightly over year-ago levels, but have been trending up from their April lows. This suggests the slowdown in residential construction may have been temporary.
Residential Real Estate Markets
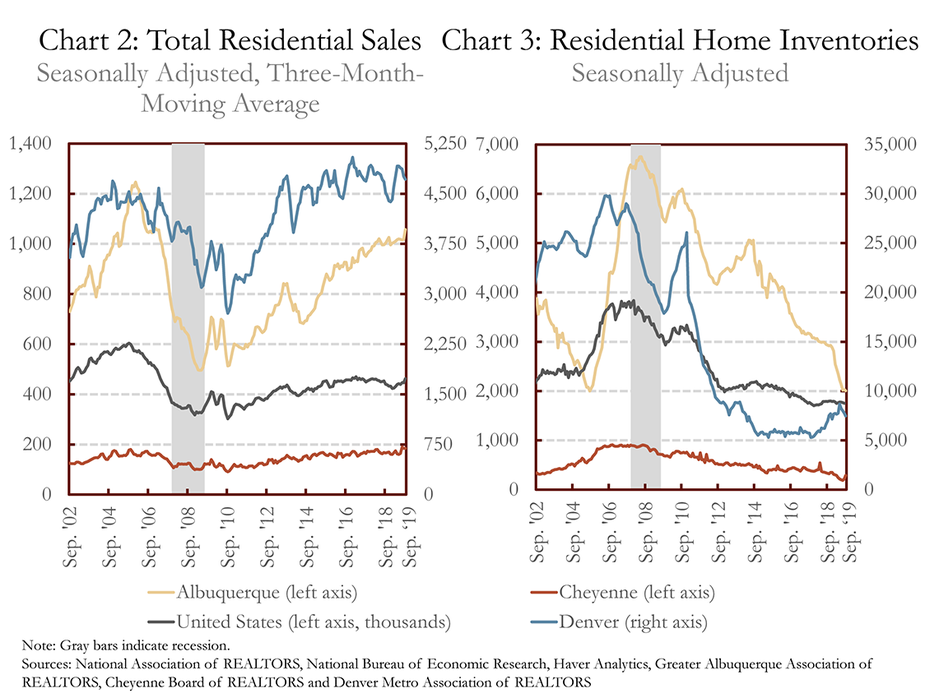
Similar to residential construction, the housing market for consumers also can be affected by economic conditions. Residential home sales fell sharply and residential home inventories rose significantly in Rocky Mountain metropolitan areas during the 2007 recession (Charts 2 and 3). In the years following the recession, home sales gradually increased, helping to reduce inventory levels over time. Home sales in Denver and Cheyenne now have surpassed their pre-recession peak levels, while home sales in Albuquerque and the United States remain about 18 percent and 26 percent, respectively, below their pre-recession peaks.iii Inventories have fallen below pre-recession levels in the United States, Denver and Cheyenne, while Albuquerque’s inventory is just slightly above its pre-recession low from 2005.
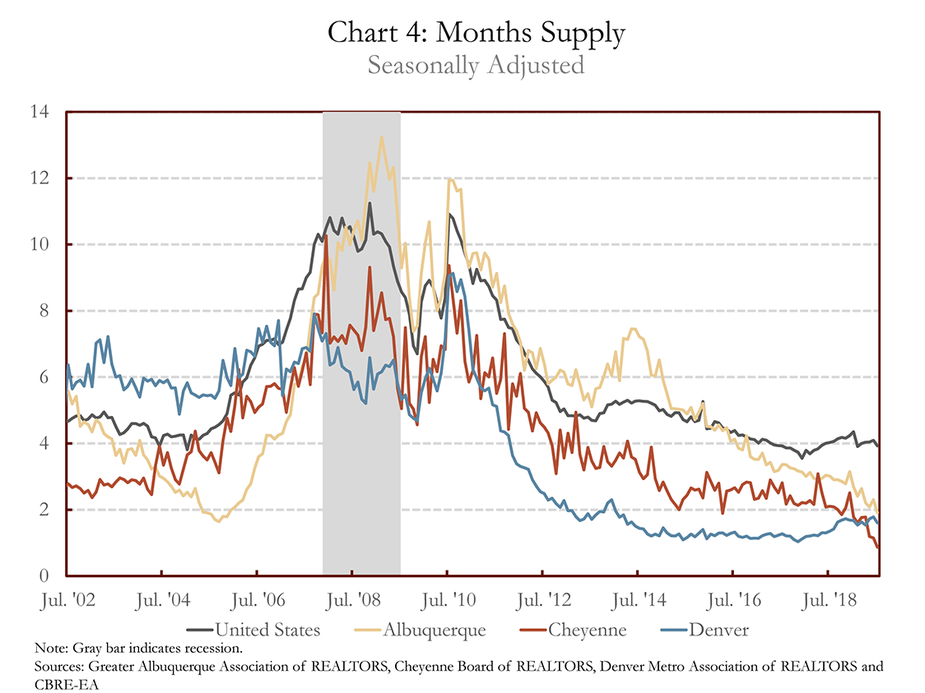
Rising demand (sales) for residential homes combined with falling supply (inventories) has tightened residential real estate markets across major metropolitan cities in the Rocky Mountain States, shifting the real estate market from a buyers’ market during the recession to a sellers’ market in recent years. Months supply is a common metric used for gauging conditions in the housing market and is calculated by dividing inventory by sales in a month. In other words, months supply estimates how long it would take to sell all of the existing inventory of homes at the current sales rate assuming no new homes enter the market. Months supply rose sharply during the Great Recession, but since has fallen significantly in the Rocky Mountain region and the United States (Chart 4).
The months supply of homes on the market currently is about two months in Albuquerque, Denver and Cheyenne, which is below the months supply of four nationally. The average months supply in the United States dating to 1963 is about six months, and that number generally is viewed as indicating a balanced residential real estate market. Overall, the current months supply in Denver, Albuquerque and Cheyenne represents a historically tight housing market in which supply has struggled to keep pace with demand and sellers have had the pricing advantage. More recently, sales have continued to rise in Cheyenne and Albuquerque and inventories and the months supply have continued to decline. However, in Denver the months supply has risen from a low of one month in late 2017 to about 1.7 months in September 2019. In addition, home sales slowed in late 2018 in Denver but recently have picked up.
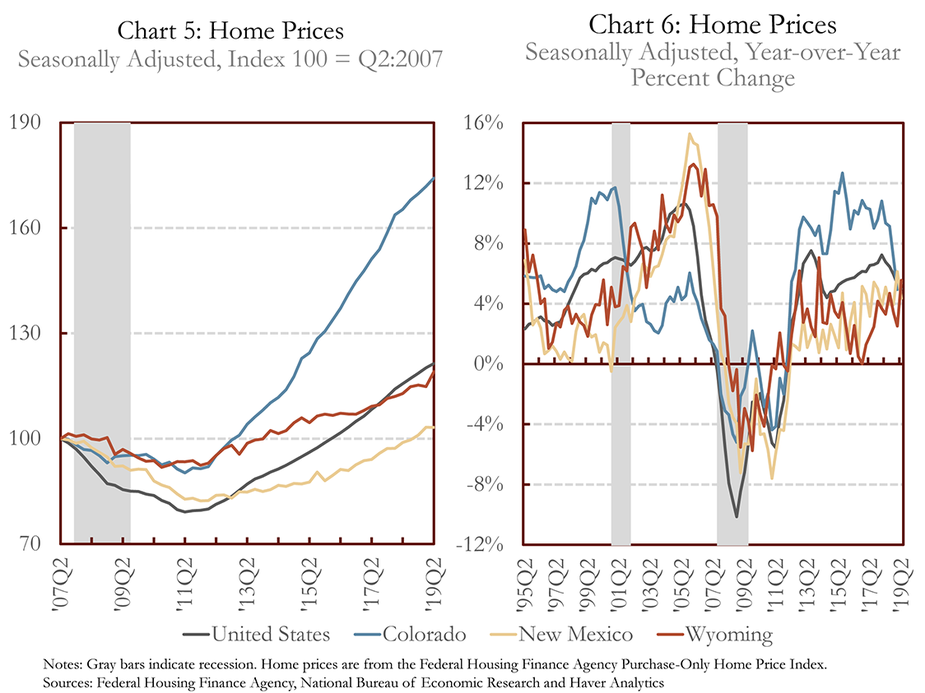
As inventories fell and real estate markets tightened across the Rocky Mountain region, home prices started to rise. And, after more than seven years of appreciation, home prices have surpassed their pre-recession peaks in Colorado, New Mexico and Wyoming (Chart 5). Home price appreciation has been particularly strong in Colorado where extremely low inventories and high demand have led to annual price gains exceeding 10 percent for more than five years (Chart 6).iv Home price appreciation has been more modest in New Mexico and Wyoming, with annual price growth around 4 percent in recent years. The pace of home price appreciation has slowed in Colorado and the nation in recent quarters, but has held up in New Mexico and Wyoming. In Colorado, home prices are up 5.4 percent compared with a year ago which is a healthy pace of growth, but well below the double-digit gains experienced just a couple of years ago.
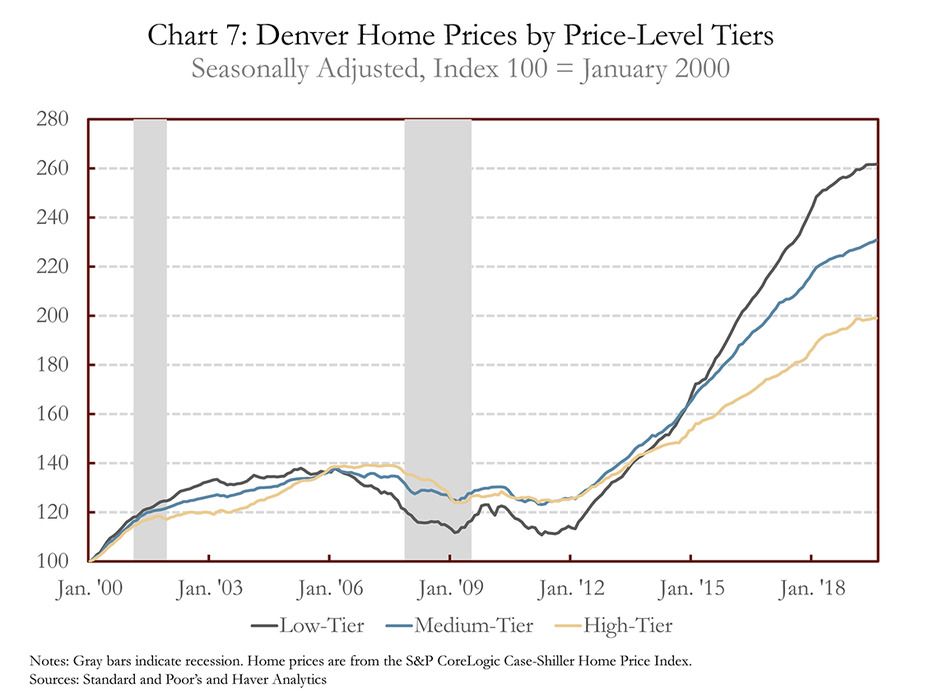
Home prices in the Denver metropolitan area have surged over the past 10 years, and indexes from S&P CoreLogic Case-Shiller allow us to examine Denver home price growth for low-, medium- and high-priced homes (Chart 7).v Although home prices declined most sharply for the lowest-priced tier during the recession, prices for homes in this category have grown at the fastest rate over the past 10 years. From their respective troughs (near 2009), home prices in the low-, medium- and high-priced tiers have grown 136 percent, 87 percent and 61 percent, respectively. This rapid growth in low-priced homes has led to affordability concerns, with home price appreciation exceeding income gains over this time period.
Conclusion
Residential real estate and construction activity tends to be cyclical—rising and falling along with the strength of the overall economy. During the Great Recession, residential construction, home sales and home prices fell significantly, while home inventories rose sharply. In the years following the recession, residential construction and real estate conditions have been improving gradually and inventories now suggest real estate conditions are tight in Colorado, New Mexico in Wyoming. Over the past year, some indicators have suggested that the residential housing market may be slowing, particularly in Colorado. In late 2018 and early 2019, single-family permitting, home sales and home price appreciation started to slow in Colorado and inventories moved higher. Over recent months, however, permitting has strengthened and home sales have increased across the entire Rocky Mountain region.
End Notes
i Census Bureau, Building Permits Survey.
ii Ibid.
iii Despite surpassing its peak from 2005, Denver sales actually were much higher in the late 1990s as the tech boom led to rapid growth across Colorado.
iv Home price growth for Denver follows a very similar path to that of Colorado overall.
v The low-, medium- and high-tiers are created so that there is an even amount of sales in each category (a third of total sales for each of the three groups). For more information, see the S&P CoreLogic Case-Shiller Home Price Indices methodology here: External Linkhttps://us.spindices.com/index-family/real-estate/sp-corelogic-case-shiller