Survey Description
Small business lending conditions were generally stable in the first quarter of 2018. According to the Federal Reserve’s Small Business Lending Survey, new small business loans made in the first quarter of 2018 and drawdowns of credit lines were about the same as in the fourth quarter of 2017. Loan demand, application approval rates and credit quality also were steady. However, loan rates rose and some lending terms tightened, particularly loan covenants and interest rate floors.
Chart 1: Small Business C&I Loan Balances Decline Modestly
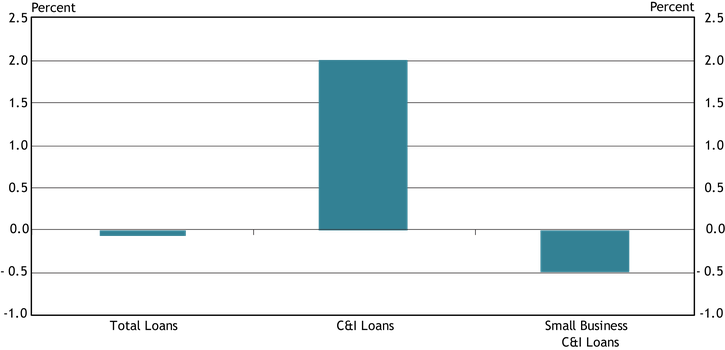
Sources: Call Reports, schedule RC-C, items 4 and 12. FR 2028D, items 4.b and 5.c. Note: Items are calculated using a subset of respondents that completed the FR 2028D for both 2017:Q4 and 2018:Q1.
Total outstanding loans declined marginally from the fourth quarter of 2017 to the first quarter of 2018 for the subset of FR 2028D filers that completed the survey in both periods, while outstanding C&I loan balances grew._ Small business C&I loan balances decreased 0.5 percent, driven by a 2.5 percent decline in small business C&I term loan balances.
Chart 2: New Small Business C&I Originations Steady
Chart 2: New Small Business C&I Originations Steady
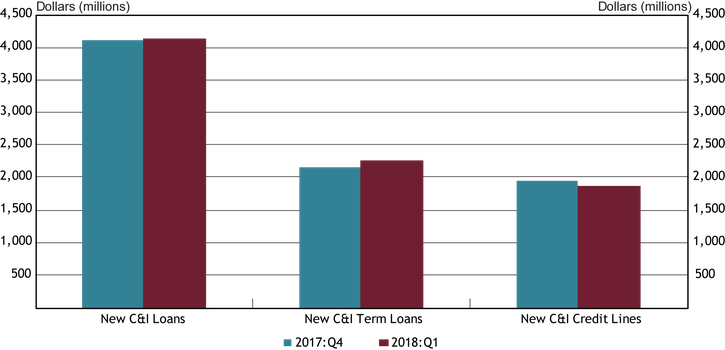
Source: FR 2028D, items 7.b and 10.c. Note: Items are calculated using a subset of respondents that completed the FR 2028D for both 2017:Q4 and 2018:Q1.
The dollar volume of new small business C&I loans in the first quarter was essentially unchanged from the previous quarter. This indicates that the decrease in small business C&I loans this quarter (Chart 1) is not due to a reduction in new lending.
Chart 3: Credit Line Usage Remains Stable
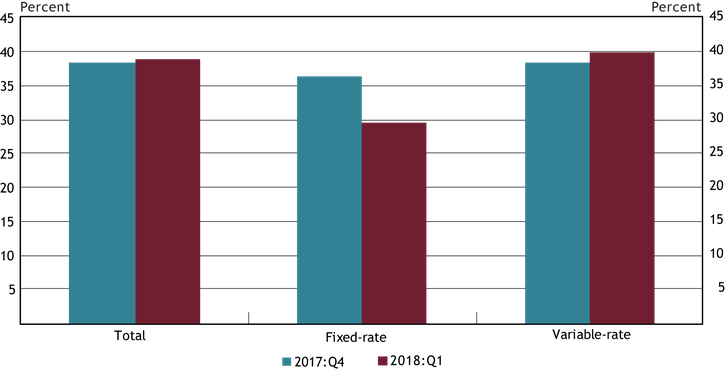
Source: FR 2028D, items 5.b and 5.c. Note: The 2017:Q4 calculation uses a subsample of the data collected for sample consistency.
Total credit line usage was largely unchanged from the fourth quarter of 2017 to the first quarter of 2018, increasing only 1.4 percent. Fixed-rate credit line usage declined 18.5 percent during the first quarter. However, that decrease was more than offset by the 3.7 percent increase in variable-rate line usage because variable-rate line volumes are more than 10 times that of fixed-rate credit lines.
Chart 4: Interest Rates on New Small Business C&I Loans Rising

Source: FR 2028D, items 7.c and 10.d. Note: Items are calculated using a subset of respondents that completed the FR 2028D for both 2017:Q4 and 2018:Q1.
The weighted average interest rates on term loans increased 1.1 percentage points for fixed-rate loans to 6.1 percent and 0.4 percentage points for variable-rate loans to 5.1 percent. On lines of credit, rates increased 0.25 percentage points for fixed-rate loans to 5.6 percent, but decreased 0.25 percentage points on variable rate loans to 4.5 percent.
Chart 5: New Small Business C&I Loan Rates Varied Widely by Bank Size
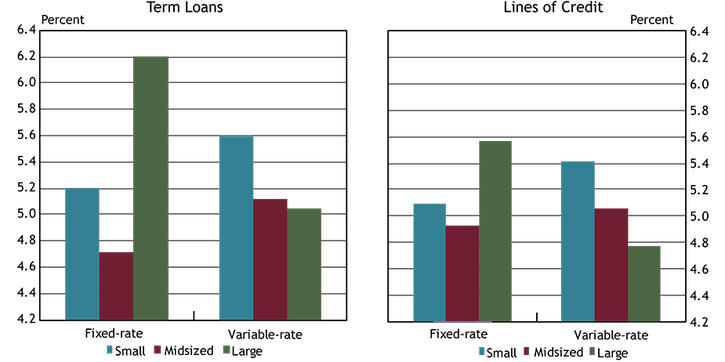
Source: FR 2028D, items 7.c and 10.d. Note: Average interest rates are weighted by the dollar volume of new small business C&I loans. Small banks have total assets of $1 billion or less, midsized banks have total assets between $1 billion and $10 billion and large banks have total assets greater than $10 billion.
In the first quarter, weighted average interest rates varied widely across bank sizes, ranging from 4.7 to 6.2 percent. In general, large banks had the highest rates on fixed-rate loans and the lowest rates on variable rate loans. Small banks charged higher rates than midsized banks for all loan types.
Chart 6: Credit Line Usage Stable for Large Majority of Banks
Source: FR 2028D, item 11. Note: Small banks have total assets of $1 billion or less, midsized banks have total assets between $1 billion and $10 billion and large banks have total assets greater than $10 billion.
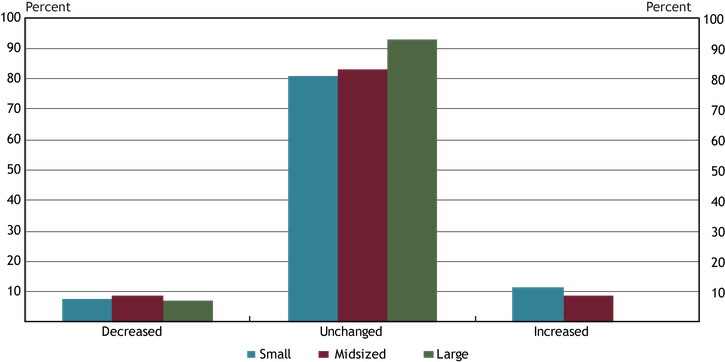
About 85 percent of panelists reported that credit line usage did not change during the first quarter of 2018, which is consistent with the usage data in Chart 2. For those banks that reported a change, large banks only reported a decline in usage, while small and midsized banks were about evenly split between an increase and a decrease in credit line usage. The most commonly cited reasons for a change - whether an increase or decrease - were changes in local or national economic conditions and in borrowers’ business revenue or other business-specific conditions.
Chart 7: Loan Demand Relatively Stable for Most Banks
Source: FR 2028D, item 17. Note: Small banks have total assets of $1 billion or less, midsized banks have total assets between $1 billion and $10 billion and large banks have total assets greater than $10 billion.
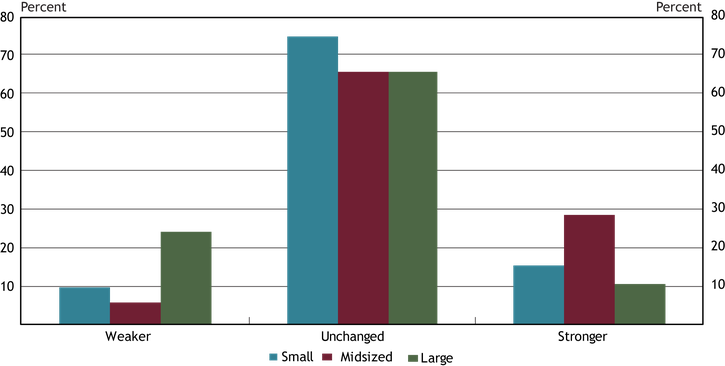
Overall, 70 percent of respondents indicated no change in demand for small business C&I loans during the first quarter of 2018. Among the 30 percent reporting a change, more respondents experienced stronger than weaker demand. About 35 percent of midsized and large banks reported a change in loan demand. Among these banks, almost 30 percent of midsized banks reported a strengthening, while 25 percent of large banks reported a weakening.
Chart 8: Application Approval Rates are Mostly Unchanged from 2017:Q4, but Decline with Bank Size
Source: FR 2028D, item 14.a. Note: Small banks have total assets of $1 billion or less, midsized banks have total assets between $1 billion and $10 billion and large banks have total assets greater than $10 billion.
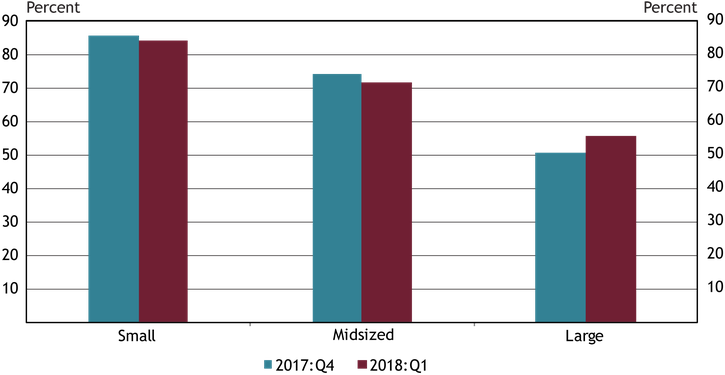
Application approval rates varied from 84 percent at small institutions to 56 percent at large institutions during the first quarter of 2018. Approval rates were just slightly lower for small and midsized banks than during the prior quarter, but higher for large banks. The most commonly cited reason for denying a loan was borrower financials, while collateral and credit history also were cited by some respondents.
Chart 9: Credit Quality Stable for Most Banks
Source: FR 2028D, item 11. Note: Small banks have total assets of $1 billion or less, midsized banks have total assets between $1 billion and $10 billion and large banks have total assets greater than $10 billion.
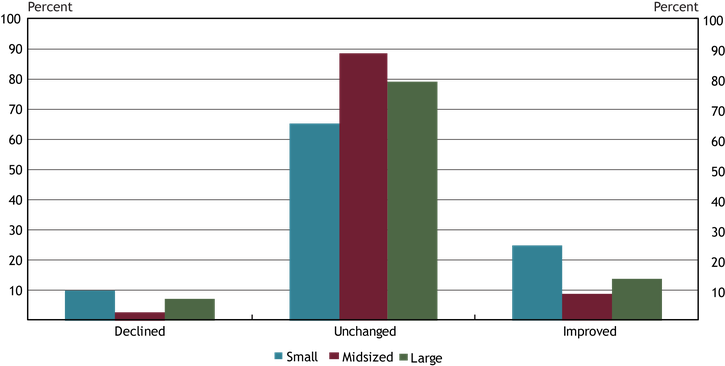
Only about 25 percent of panelists reported a change in applicant credit quality over the quarter, with the majority of those panelists reporting an improvement. About half of the panelists cited a change in the debt-to-income level of business owners as a very important reason for the improved credit quality. Other important reasons contributing to the gains in credit quality were the improved liquidity position of business owners, recent business income growth, and improved prospects for business growth or enterprise value.
Chart 10: More Banks Reporting Tighter Credit Terms
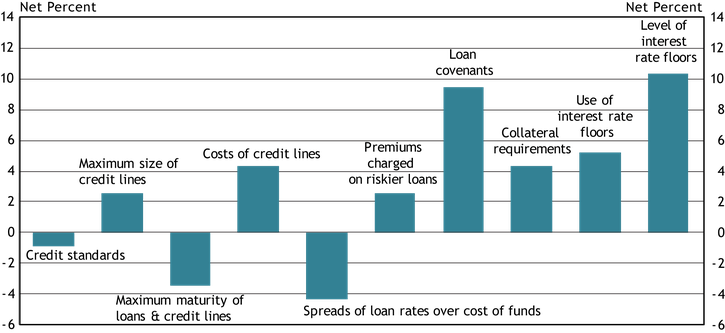
Source: FR 2028D, items 18 and 19. Notes: The net percent refers to the percent of banks that reported having tightened ("tightened considerably" or "tightened somewhat") minus the percent of banks that reported having eased ("eased considerably" or "eased somewhat").
Roughly 40 percent of the panelists indicated some change in credit standards or terms for small business C&I loans during the first quarter of 2018. The chart shows diffusion indexes for credit standards (left-most bar) and various loan terms, which is the difference between the percent of banks reporting a tightening and those reporting an easing. On net, credit standards remained basically unchanged in the most recent quarter, while banks tightened terms in all but two categories. Loan covenants and the level of interest rate floors were the terms with the greatest degree of tightening.
Nearly 70 percent of the respondents who reported tightening indicated that worsening of industry-specific problems and a reduced tolerance for risk were important factors in that decision. Other commonly cited reasons included less favorable or more uncertain economic outlook and increased concerns about the effects of legislative changes, supervisory actions, or changes in accounting standards. Nearly 90 percent of respondents who indicated easing standards or terms reported that more aggressive competition from other banks was an important factor in that decision, and 64 percent of respondents cited more aggressive competition from nonbank lenders as important.
Contact Us
For questions or comments about this survey, contact us at KC SRM FR2028D Survey.
Endnotes
-
1
The respondent sample for the 2018:Q1 reporting period is 116 banks with $5.8 trillion in assets. The number of respondents is lower for some questions, which is indicated in the accompanying survey data tables.