Farm debt continued to increase alongside faster growth in farm production loans. Similar to recent quarters, outstanding agricultural loan balances at commercial banks increased by about 5%. Non-real estate loans increased at the fastest pace since 2016 while growth in real estate loans slowed slightly. Even as debt balances continued to grow, farm loan performance remained strong and delinquency rates edged lower for the third consecutive year. The net interest margin and return on assets at agricultural banks were higher than a year ago, but softened slightly from the previous quarter as funding costs for lenders continued to rise.
The outlook for agricultural credit conditions remained strong despite a recent moderation in the farm economy. A slight pullback in the prices of key farm products and elevated expenses could thin margins for some producers, but farm finances remained strong following several years of considerable strength. Rising production costs and depletion of working capital could further increase credit needs, particularly for producers who have used cash reserves to reduce loan levels in recent years. Although a growing share of lenders expect farm income and repayment rates to soften in the months ahead, agricultural credit conditions are likely to remain strong through 2023.
Second Quarter Commercial Bank Call Report Data
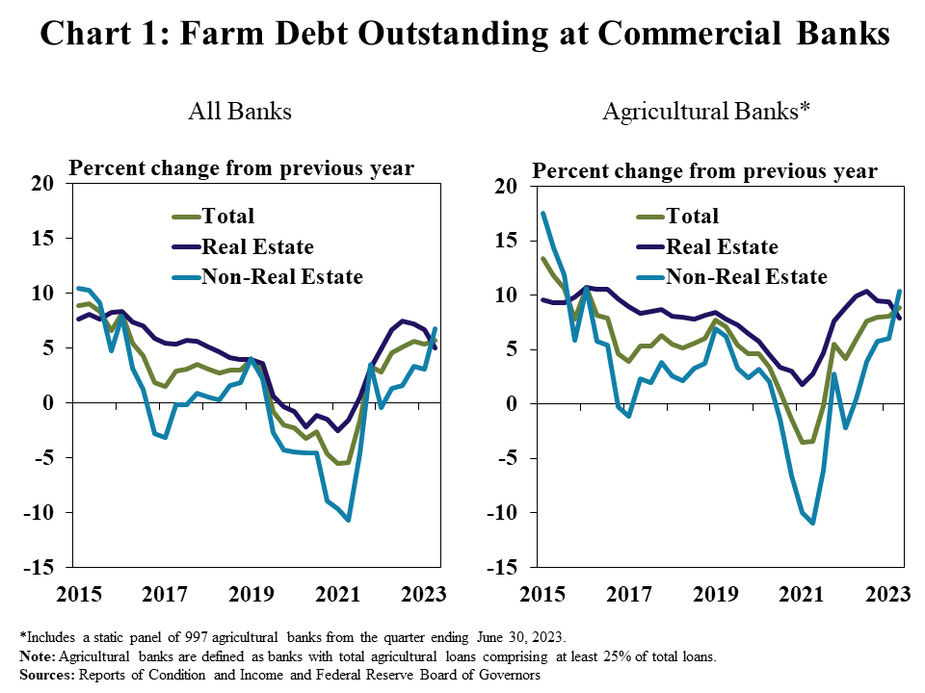
Faster growth in non-real estate lending kept increases in farm debt steady in the second quarter. Outstanding farm production and farm real estate loans at all commercial banks increased 7% and 5% from a year ago, respectively (Chart 1, left panel). Growth was stronger among agricultural banks, with non-real estate and farmland loans increasing 10% and 8% during the second quarter, respectively (Chart 1, right panel).
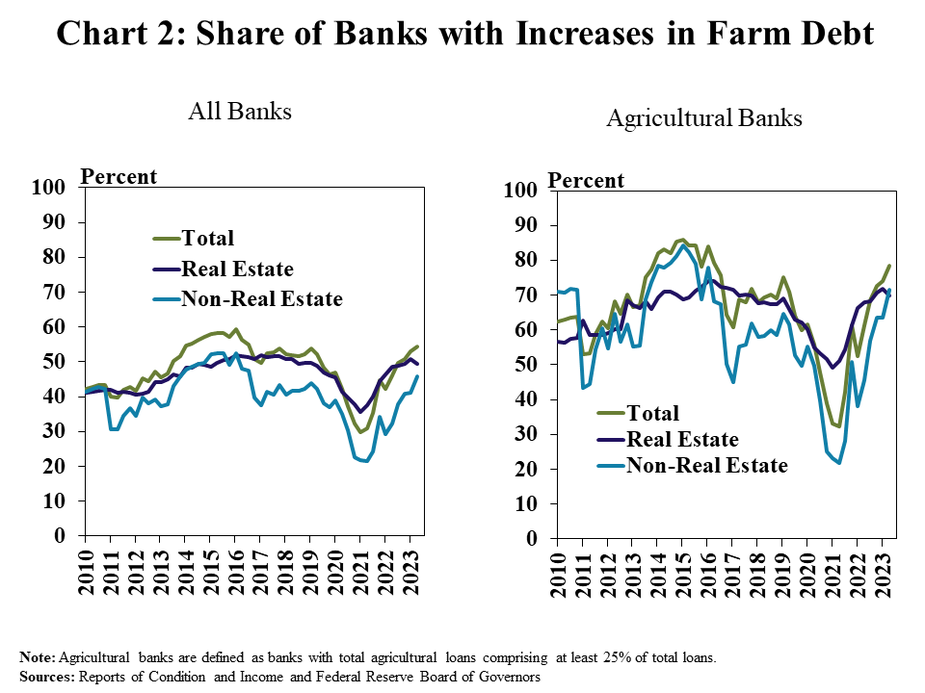
Growth in farm loan balances was more pronounced than in recent years, particularly for agricultural banks. Farm debt increased from a year ago at slightly more than half of all banks, the largest share since 2016 (Chart 2, left panel). In comparison, farm loan balances grew at nearly 80% of agricultural banks (Chart 2, right panel).
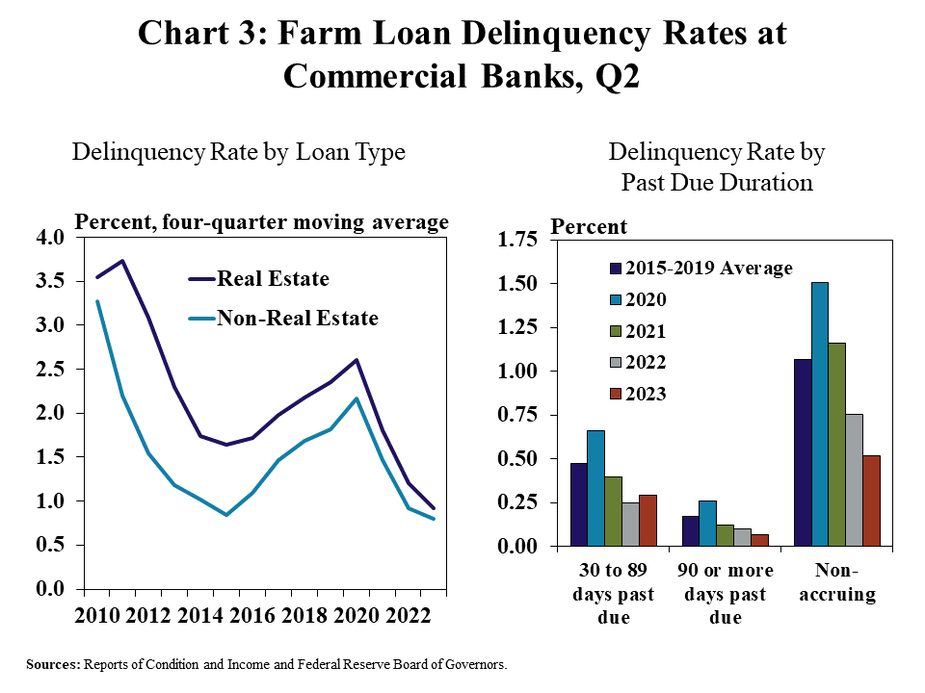
Broad strength in farm finances continued to support gradual improvement in loan performances. Delinquency rates improved further in the second quarter and reached the lowest level since 2010 for real estate and non-real estate loans (Chart 3, left panel). A reduction in balances of non-accruing loans and loans past due of 90 days or more counterbalanced a slight uptick in shorter term past dues (Chart 3, right panel). Despite a small increase in short term delinquencies, overall credit quality at agricultural banks remained strong.
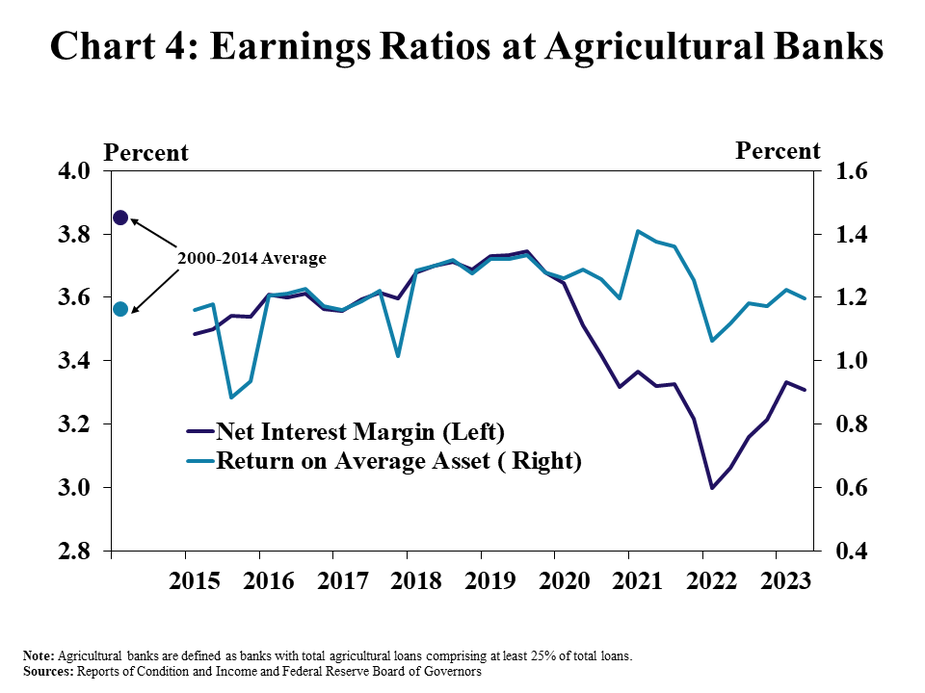
Earnings at agricultural banks remained sound, despite a slight pullback from last quarter. While ag banks experienced a decrease in growth in interest margins from the previous quarter, margins remained 25 basis points higher than the same time last year and were consistent with the levels in 2021 (Chart 4). Return on average assets was largely steady from last quarter and profitability remained near the average from 2000-2014.
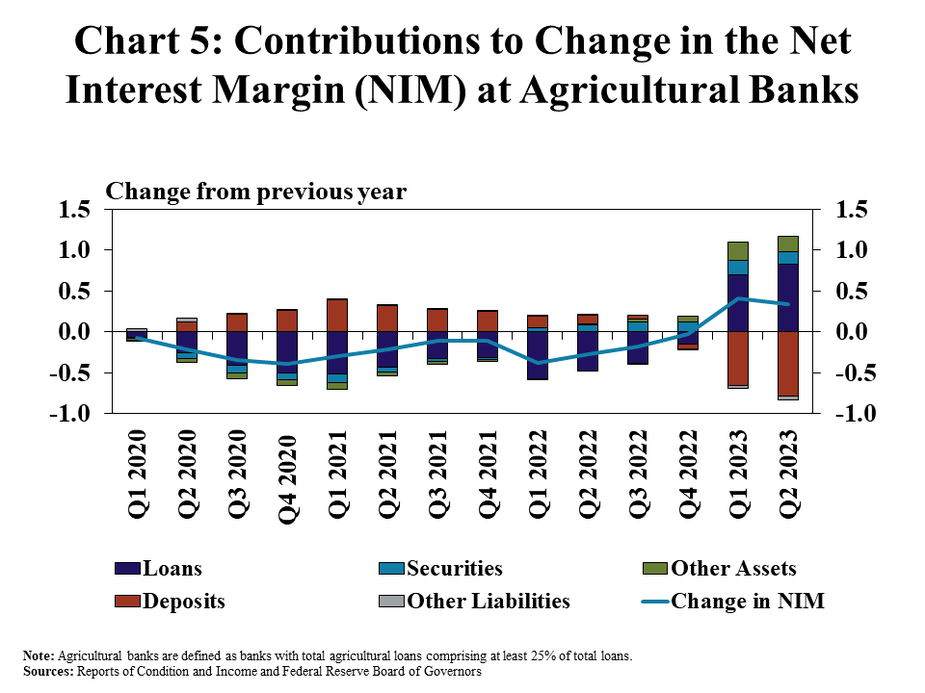
Strong growth in loan interest over the past year continued to offset higher deposit expenses and support net interest margins. Net interest margins at agricultural banks increased from a year ago during the last two quarters, reversing the negative trend in margins since 2020 (Chart 5). Higher net interest incomes in early 2023 were largely attributed to stronger income generated from loans, which more than offset growth in deposit expenses that have dampened margins.
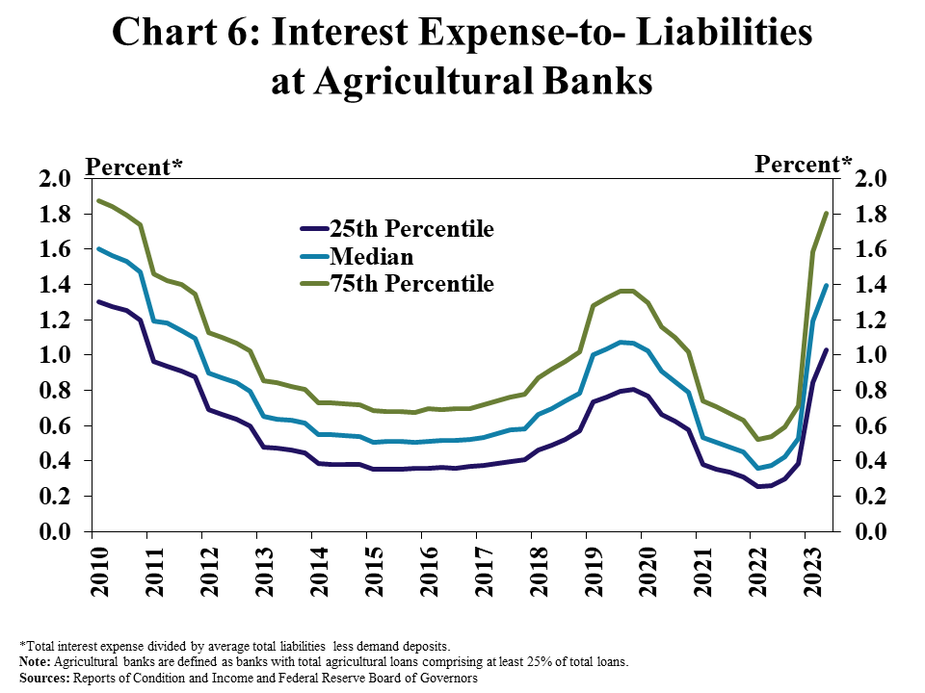
Despite improving from a year ago, interest margins flattened slightly over the past quarter alongside a considerable rise in funding costs. The share of interest expenses to average liabilities at agricultural banks reached the highest levels since 2010 (Chart 6). Higher benchmark interest rates and strong competition have put upward pressure on deposit costs and led many community banks to source other forms funding, pushing up funding costs and putting downward pressure on margins.