In March 2020, uncertainty surrounding the coronavirus pandemic sapped liquidity in Treasury markets, rendering the sale of Treasury securities unusually difficult. This liquidity crunch posed threats to the stability of the financial system more broadly. Treasuries play a central role in financial markets, serving not only as a means to finance the U.S. federal government, but also as a store of value, a hedging vehicle for global investors, and a key benchmark for other financial instruments. To limit financial fallout from the Treasury market sell-off, the Federal Reserve intervened quickly, purchasing assets at a much greater speed and scale than it had during the early months of the 2007–08 financial crisis.
To assess how Treasury markets responded to the onset of the pandemic and the Federal Reserve’s subsequent interventions, I examine changes in Treasury liquidity as quantified by the G-spread. The G-spread measures the difference between the yields of past and present issuances of Treasury securities with the same maturities. In other words, the G-spread measures the spread between two assets that differ only in their liquidity, or their ease of conversion into cash. Freshly issued, or “on-the-run,” Treasury securities are considered more liquid because they behave almost like money—primary dealers are more willing to buy them because they can market them relatively easily to another dealer or a final investor._ While on-the-run securities are the most actively traded, often accounting for the majority of total daily trading volumes, they make up less than 5 percent of outstanding marketable Treasury securities. The remainder of marketable securities comprise older, “off-the-run” Treasury vintages, generally in the hands of final investors.
Once a Treasury security is off-the-run, it tends to trade less often. Thus, firms become less inclined to hold off-the-run Treasury securities when they might need to liquidate them quickly. In these circumstances, off-the-run Treasury prices fall relative to on-the-run Treasuries of the same maturity and coupon. By capturing the size of the discount on an off-the-run Treasury security relative to a hypothetical on-the-run Treasury security of the same remaining maturity and coupon, the G-spread provides a useful gauge of liquidity risk in Treasury markets.
By this measure, in March 2020 liquidity pressures reached heights not observed since the global financial crisis of 2007–08. Chart 1 shows the 15-day moving average of the G-spread over time. During the initial shock of the global financial crisis, the G-spread spiked due to a suspension of trading in asset-backed commercial paper that led to severe financing strains for banks and other financial institutions._ Although recent financial strain emanated from a different source, the first quarter of 2020 also saw the Treasury market experience a sudden bout of severe illiquidity. Plunging oil prices and the COVID-19 outbreak fueled concerns about the macroeconomic outlook and uncertainty about the implications for financial markets, motivating investors to swiftly sell Treasury securities to raise cash in their portfolios.
Chart 1: The Average G-Spread
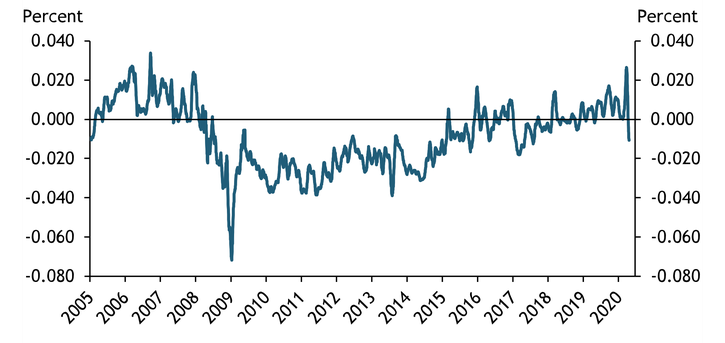
Note: The G-spread depicted is the average spread between on-the-run and off-the-run Treasury yields at maturities of two, five, and 10 years averaged over the previous 15 days.
Source: Wall Street Journal (Haver Analytics).
As investors offloaded Treasury securities, dealers were expected to take the other side of the transaction and become buyers. This resulted in a substantial sum of Treasuries accumulating on dealer balance sheets, exposing dealers to risk that they could not offset, as the derivatives market was facing liquidity constraints at the same time._ Together with end-quarter concerns about regulatory requirements, the inability of dealers to hedge any further purchases further decreased overall market liquidity.
In response, the Federal Reserve rapidly purchased Treasury assets and agency mortgage-backed securities (MBS) to provide cash to investment funds. By meeting the financial system’s demand for cash, the Federal Reserve increased liquidity, reduced liquidity risk, and stabilized the Treasury market.
The speed and scale of the current crisis and response stand out compared with the Federal Reserve’s interventions in the early days of the 2007–08 financial crisis. As shown in Chart 2, the Federal Reserve began asset purchases much sooner after the beginning of the current crisis than after the crash of Lehman Brothers in September 2008._ In the 10 weeks since the current intervention began on March 22, the Federal Reserve purchased a larger sum of Treasury securities than in the 26 weeks following the collapse of Lehman. Moreover, the Federal Reserve extended additional credit through facilities such as the Money Market Mutual Fund Liquidity Facility, the Primary Dealer Credit Facility, and the Commercial Paper Funding Facility to parts of the financial system experiencing liquidity shortfalls, relieving some pressure to liquidate Treasuries.
Chart 2: Securities Purchases during the 2007–08 Financial Crisis and 2020
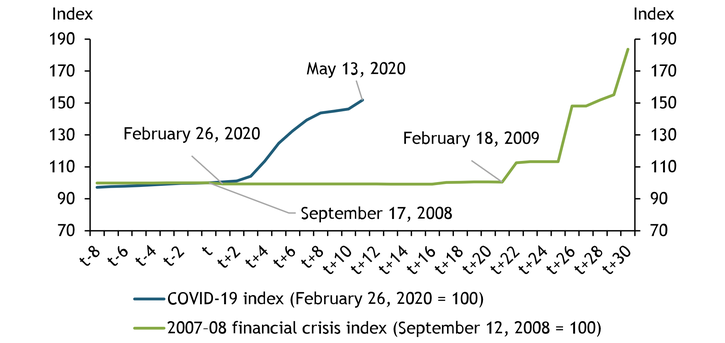
Note: The horizontal axis denotes weeks since t, where t corresponds to the collapse of Lehman Brothers (green line) and the beginning of the COVID-19 crisis (blue line).
Source: Board of Governors of the Federal Reserve System (FRED).
Chart 3 shows the liquidity-boosting effect of Federal Reserve purchases reflected in the G-spread following the Federal Reserve’s March 22 announcement of large-scale asset purchases. Although the 15-day moving average of the G-spread rose sharply in late February and March, it began to fall almost immediately after the Federal Reserve’s announcement and has remained low since.
Chart 3: The G-Spread in 2020
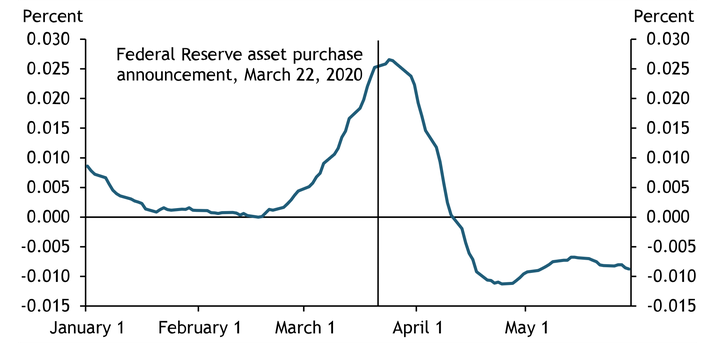
Note: The G-spread depicted is the average spread between on-the-run and off-the-run Treasury yields at maturities of two, five, and 10 years averaged over the previous 15 days.
Source: Wall Street Journal (Haver Analytics).
Overall, the behavior of the G-spread suggests that the Federal Reserve’s interventions were effective in restoring liquidity to Treasury markets. The unprecedented speed and scale of these interventions may help explain their success in supporting market function. Going forward, the G-spread will likely provide a useful measure of the effectiveness of Federal Reserve policy in forestalling financial market contagion.
Endnotes
-
1
A primary dealer is a firm that buys government securities directly from the Treasury with the intention of reselling them to others. Primary dealers also act as trading counterparties of the Federal Reserve Bank of New York in its implementation of monetary policy.
-
2
Asset-backed commercial paper is a short-term money market security with a maturity typically between 90 and 270 days. These securities are issued by a bank or other financial institution and are backed by collateral to fund the short-term financing needs of businesses.
-
3
A derivative is a financial security with a value that is based on, or derived from, an underlying asset or group of assets. The derivative itself is a contract between two or more parties, deriving its price from fluctuations in the underlying asset. Examples include futures, forwards, options, and swaps
-
4
Although the current crisis has a discrete beginning, the 2007–08 financial crisis and associated volatility in financial markets have no widely agreed-upon start date. This article references the crash of Lehman Brothers as an inciting event; however, the crisis arguably began in August 2007 after BNP Paribas announced it was suspending withdrawals from three funds invested in asset-backed commercial paper, which had a marked effect on the trading of commercial paper.
Karlye Dilts Stedman is an economist at the Federal Reserve Bank of Kansas City. The views expressed are those of the author and do not necessarily reflect the positions of the Federal Reserve Bank of Kansas City or the Federal Reserve System.