The surge in home prices that followed the onset of the COVID-19 pandemic and the sharp increase in interest rates during 2022 have driven up the cost of purchasing a home. Although purchase demand has contracted and sales of single-family homes have plummeted, home prices have declined only modestly, leading many prospective homeowners to question whether relief is on the way.
Mortgage interest rates have fallen off from their peak in late 2022 but otherwise remain at their highest level in 15 years. The green line in Chart 1 shows the fixed rate on a 30-year mortgage. The 30-year rate moved down during 2019 in response to the Federal Reserve easing monetary policy. Mortgage rates continued to decline following the onset of the pandemic as the Fed eased policy further to cushion the economy, settling close to 3 percent from mid-2020 through the end of 2021. During 2022, however, the Federal Reserve tightened policy to fight inflation, and mortgage rates shot up, ending at 6.1 percent in early February 2023.
Chart 1: Home prices and mortgage interest rates rose sharply during the pandemic
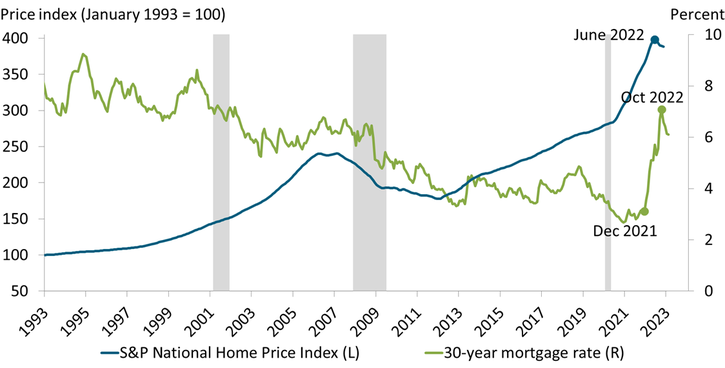
Notes: Price data are through November 2022; mortgage rates are through early February 2023. Gray shaded areas indicate recessions as defined by the National Bureau of Economic Research (NBER).
Sources: Standard and Poor’s, Federal Home Loan Mortgage Corporation, and NBER. All data accessed through Haver Analytics.
Home prices rose sharply following the onset of the pandemic. The blue line in Chart 1 shows a national index of single-family home prices. Prior to the pandemic, from 2014 to 2019, prices climbed approximately 5 percent annually, driven up by more than a decade of weak home construction (Rappaport 2022). Following the onset of the pandemic in early 2020, prices surged, ultimately peaking in mid-2022 at 42 percent above their level in early 2020. Prospective buyers competed fiercely from mid-2020 through mid-2022, often bidding up prices on newly listed homes to the maximum offer they could afford. The surge in purchase demand was partly driven by the decline in interest rates, which lowered monthly payments. It may also have been driven by a shift in households’ preferences for more living space due to spending more time at home during the pandemic and the prospect of working remotely at least some of the time over the longer term.
The increases in both home prices and mortgage rates since early 2020 have more than doubled the monthly mortgage payment on a newly purchased home. The blue line in Chart 2 shows how the monthly payment of principal and interest would differ if someone who purchased a $250,000 home in January 2020 (a bit below the national median then) were to instead purchase that same home later in the pandemic. With a 20 percent down payment, the monthly payment in January 2020 would have been $899, good for the 30-year life of the loan. The monthly payment to purchase the same home later in 2020 would have been roughly the same, reflecting that the upward movement in home prices was offset by the downward movement in mortgage rates. At the start of 2021, however, the monthly payment began moving up, gradually at first and then sharply, peaking at almost $1,900 per month in October 2022. This doubling of the monthly mortgage payment has likely made purchasing a home—already a considerable financial challenge prior to the pandemic—insurmountable for many more households.
Chart 2: Monthly payment to purchase the same home has more than doubled since January 2020
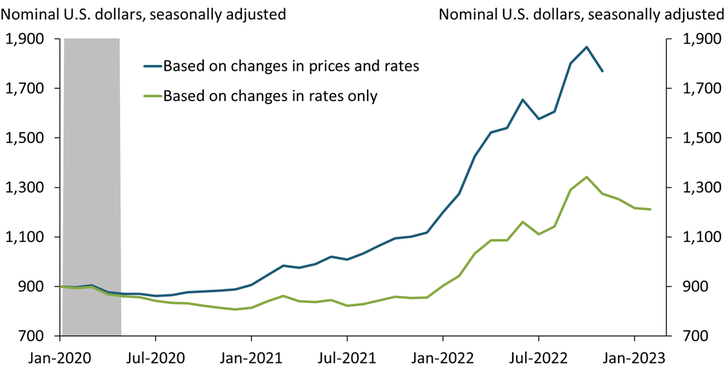
Notes: Chart is based on a 20 percent down payment on a home that would sell for $250,000 in January 2020. Price data are through November 2022; mortgage rates are through early February 2023. Gray shaded area indicates NBER-defined recession.
Sources: Standard and Poor’s, Federal Home Loan Mortgage Corporation, NBER, and author’s calculations. All data accessed through Haver Analytics.
Indeed, the increase in mortgage rates alone may make it unaffordable for many owners to sell their current home and purchase a different one at the same sales price. The green line in Chart 2 shows how the monthly payment would differ if the home’s sales price were fixed at its January 2020 level but mortgage rates followed their actual path. In this case, the monthly payment would have increased by a net 35 percent from January 2020 to early February 2023, in effect locking some owners to their current home unless they were willing to move to a rental unit.
Home prices also appear overvalued relative to rents. Chart 3 shows an index of the ratio of homeownership costs—the opportunity cost and expenses of owning a home—relative to the rent for a similar home. The index is normalized to 100 at its average level during 1992–2001, which I use as a benchmark valuation due to the ratio’s stability during these years. I assume the opportunity cost is the interest rate on a 30-year fixed-rate mortgage times the current purchase price of a home, and that annual expenses (which cover maintenance, insurance, taxes, and a risk premium) equal 3 percent of the current purchase price. From a level 20 percent below the benchmark just prior to the pandemic, the ratio soared to more than 50 percent above it by late 2022, topping previous peaks in 1989 and 2006.
Chart 3: Home prices appear overvalued relative to rents
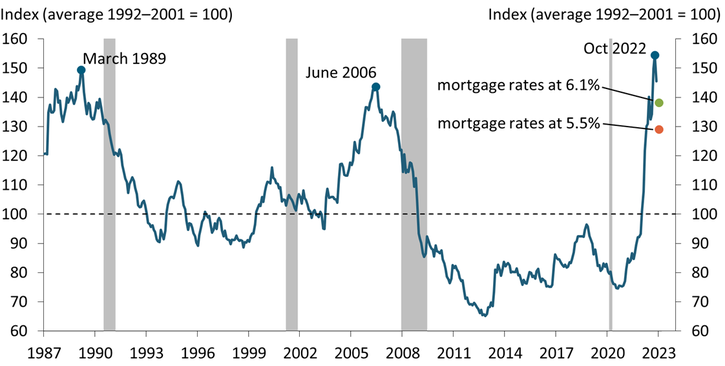
Notes: Index is the ratio of homeownership costs relative to the rent for a similar home. Price and rent data are through November 2022. Gray shaded areas indicate NBER-defined recessions.
Sources: Standard and Poor’s, Bureau of Labor Statistics, Federal Home Loan Mortgage Corporation, NBER, and author’s calculations. All data accessed through Haver Analytics.
Lowering the ratio of homeownership costs to rents will require some combination of a decline in purchase prices, a decline in mortgage rates, and an increase in rents. Based on prices and rents in November 2022 and the 6.1 percent mortgage rate prevailing in early February 2023, home prices relative to rents are overvalued by 39 percent compared with the 1992–2001 benchmark (green dot in Chart 3). If mortgage rates were instead 5.5 percent, home prices would be overvalued by 29 percent (orange dot in Chart 3). If, in addition, owner-equivalent rents were 7.5 percent higher than in November 2022—their increase during the previous 12 months—prices would still be overvalued by 20 percent. Of course, the overvaluation would be considerably larger if benchmarked by the ratio of costs to rents just prior to the pandemic.
Despite their current unaffordability and high valuation, home prices are likely to continue to move down only gradually. The large decline in demand for home purchases is being approximately matched by a decline in the supply of homes available for purchase, thereby alleviating downward pressure on prices. Chart 4 shows the number of existing single-family homes listed for sale at the end of each month and the ratio of these listings to the number of sales during that month, often described as “month’s supply.” Both have moved up since early 2022 but remain close to their historical lows. The same is true when also accounting for new homes available for sale.
Chart 4: Sales listings of existing single-family homes remain close to their recent historical low
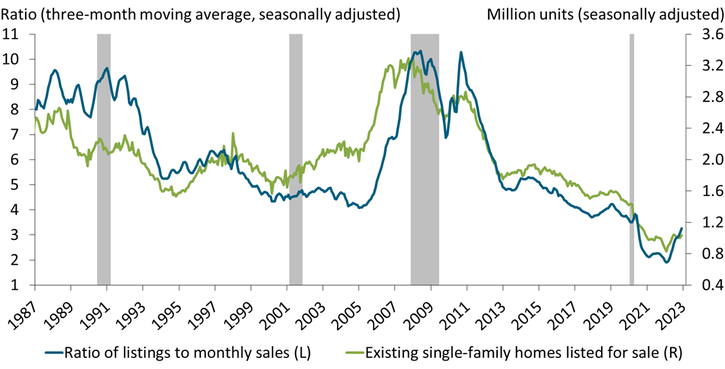
Notes: Listings are for the last day of the month and include homes under contract for sale. Data are through December 2022. Gray shaded areas indicate NBER-defined recessions.
Sources: National Association of Realtors, NBER, and author’s calculations. All data accessed through Haver Analytics.
Two considerations are likely contributing to the contraction in supply. As described above, selling a home and purchasing a different one at the same price would considerably increase monthly payments, locking many owners to their current home. In addition, many owners are likely delaying selling and moving because of loss aversion, a cognitive bias that leads them to resist selling when offered a price below a reference point—such as a price at which they believe they previously could have sold their home (Bracke and Tenreyro 2021). For these reasons, home prices are unlikely to precipitously fall.
Over the longer term, the current unaffordability and high valuation of home prices are likely to prove unsustainable. But much of the return to affordability is likely to come from rising nominal wages and an eventual decline in mortgage rates rather than a large decline in nominal home prices. Similarly, much of the return to a more sustainable valuation is likely to come from rising nominal rents and an eventual decline in mortgage rates.
References
Bracke, Phillippe, and Silvana Tenreyro. 2021. “External LinkHistory Dependence in the Housing Market.” American Economic Journal: Macroeconomics, vol. 13, no. 2, pp. 420–443.
Rappaport, Jordan. 2022. “External LinkHybrid Working, Commuting Time, and the Coming Long-Term Boom in Home Construction.” Federal Reserve Bank of Kansas City, Economic Review, vol. 107, no. 4, pp. 5–39.
Jordan Rappaport is a senior economist at the Federal Reserve Bank of Kansas City. The views expressed are those of the author and do not necessarily reflect the positions of the Federal Reserve Bank of Kansas City or the Federal Reserve System.