Consumer spending remains resilient, with an average year-over-year growth rate of about 2 percent in 2022:Q3, only a touch below its pre-pandemic pace in 2019. This strength in consumer spending has contributed to prices rising at the fastest pace in 40 years. Understanding the factors driving this growth is critical, as inflation is unlikely to abate without consumption weakening.
One major factor that typically affects consumer spending growth is real disposable personal income growth. Chart 1 shows that historically, personal consumption expenditures (PCE) and disposable personal income growth have been tightly correlated, meaning changes in spending have been closely tied to changes in income. However, this relationship broke down during the pandemic: shutdowns and subsequent re-openings, unprecedented fiscal transfers to households, and spending out of excess savings led to large and unusual swings in both income and spending. In fact, in 2022, consumption growth has been strong despite negative real income growth.
Chart 1: Strong relationship between consumption and disposable personal income growth has broken down during the pandemic
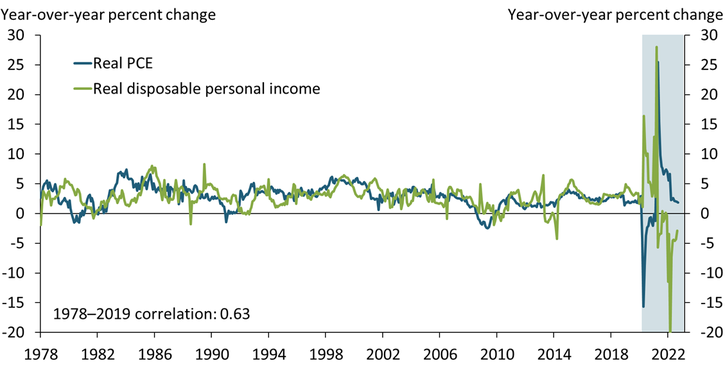
Note: The blue shaded region denotes the pandemic.
Sources: U.S. Bureau of Economic Analysis (BEA). Data accessed through Haver Analytics.
Another factor that affects consumer spending growth is households’ excess savings buffers, which have far exceeded historical levels during the pandemic. Chart 2 shows that in January 2022, the stock of real excess savings per household reached 246 percent of real disposable personal income, a historic peak. Although this share has declined in recent months, it is still very high, and households’ balance sheets remain strong. Hence, even though high inflation has weighed on households’ income, excess savings have likely continued to support spending.
Chart 2: Excess savings during the pandemic far exceed historical levels
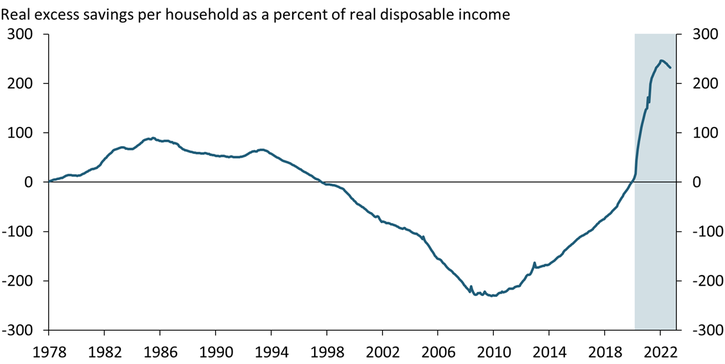
Notes: The blue shaded region denotes the pandemic. To calculate real excess savings per household, we first calculate the monthly difference between monthly real household savings and the 1978–2019 average. Then we take a cumulative sum of this series starting in January 1978 to obtain the stock of excess savings. Above-average monthly savings push up excess savings, while below-average readings decrease excess savings.
Sources: BEA, U.S. Census Bureau, and authors’ calculations. All data sources accessed through Haver Analytics.
A third factor historically linked to consumption growth is consumers’ attitudes toward spending, or spending sentiment. One way to capture consumer sentiment is through the University of Michigan’s monthly Survey of Consumers (MSC), which asks individuals whether now is a “good time” or “bad time” to buy major household items. The green line in Chart 3 shows the resulting spending sentiment index, calculated as the share of respondents with a favorable outlook on current buying conditions for durable household goods minus the share with an unfavorable outlook. Although spending sentiment (green line) and real consumption growth (blue line) historically had a strong correlation, this relationship also broke down during the pandemic. Despite spending sentiment falling to all-time lows in 2022, consumption growth has been robust.
Chart 3: Spending sentiment has fallen to all-time lows, while consumption growth has remained robust during the pandemic
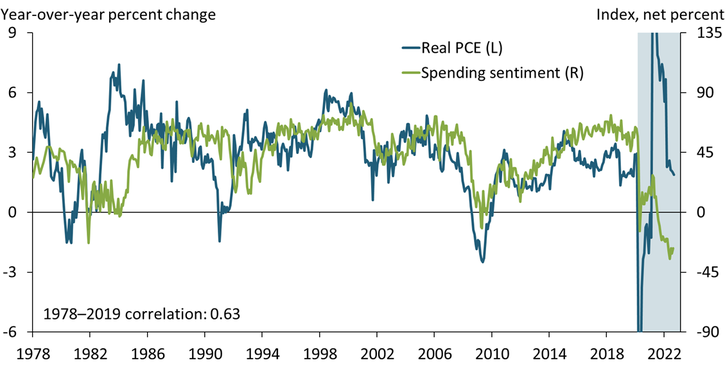
Note: The blue shaded region denotes the pandemic.
Sources: BEA, University of Michigan, and authors’ calculations. All data sources accessed through Haver Analytics.
To better understand the role of these factors in recent consumption dynamics, we estimate the relationships between these factors and consumption growth using historical pre-pandemic data (1978–2019), then use these relationships to predict consumption growth in the second and third quarters of this year._ In other words, we first assess how consumption growth might have evolved in recent quarters had the historical relationships between these factors and consumption growth been preserved. In addition to the three factors discussed previously—disposable income growth, excess savings, and spending sentiment—we also consider the current business conditions index from the University of Michigan Survey, as economic conditions also matter for spending decisions.
The left two bars in Chart 4 show the results of our predictions for 2022:Q2 and 2022:Q3 as well as how each factor contributes to these predictions. The historical relationships suggest almost no growth in consumption (orange diamonds), while actual real PCE grew by 2.4 percent and 2 percent in 2022:Q2 and 2022:Q3, respectively (black diamonds). The stacked bars show how each of our variables contributes to predicted consumption growth. Specifically, we start with the real PCE historical average growth (blue bars) and see how each variable pulls consumption growth below or above this average value. Real disposable personal income growth (green bars) makes a large negative contribution, pulling predicted consumption growth well below its historical average. Elevated excess savings (yellow bars) boosts predicted consumption growth, but this boost is more than offset by the negative spending sentiment (purple bars). These results are similar for both quarters._
Chart 4: High excess savings supported consumption growth while spending sentiment and disposable personal income growth weighed on it
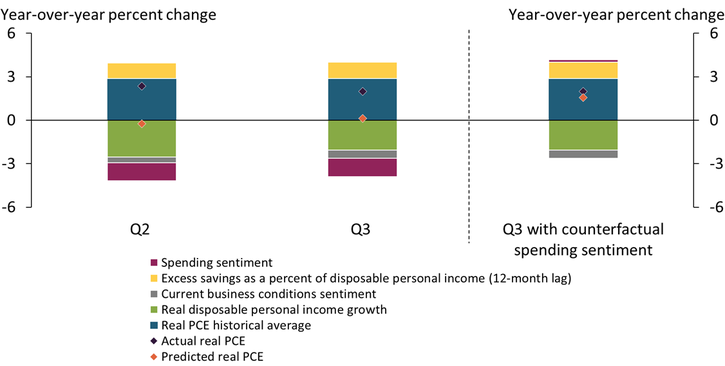
Sources: BEA, U.S. Census Bureau, University of Michigan, and authors’ calculations. All data sources accessed through Haver Analytics.
The unusual disconnect between spending sentiment and consumption is puzzling and might be contributing to the gap between predicted and actual spending growth. Typically, lower or negative spending sentiment signals that consumers are choosing not to make large household purchases (leading to lower consumption growth). However, during the pandemic, people appear to be continuing to make purchases despite their negative attitudes toward spending. This negative sentiment seems to be driven largely by high prices, as throughout 2022, an unprecedented number of respondents to the MSC have reported that it is a bad time to buy household durables because of high prices. Strong balance sheets might have given consumers the ability to continue to buy despite high prices and the resulting negative feelings. Therefore, instead of capturing consumers’ willingness to make purchases, spending sentiment could be capturing consumers’ discontent with the high prices they are paying.
To account for this change in what spending sentiment is signaling, we consider a counterfactual exercise. The far-right bar of Chart 4 shows that had sentiment been in line with current consumption growth (that is, if consumers had felt better about the purchases they were actually making), predicted consumption growth in Q3 (orange diamond) would have been positive and much closer to actual consumption growth (black diamond)._ In other words, accounting for the atypical signal from consumer spending sentiment bridges nearly all of the gap between predicted and actual growth.
Historically, real disposable income growth and spending sentiment have been strong and useful predictors of consumption growth. Although these relationships seem to have broken down during the pandemic, they are likely to normalize as pandemic-era effects, such as high excess savings, fade. As excess savings run down amid weak real income growth, consumers will likely become much more selective in their purchases and not make purchases when they feel it is a bad time to buy, which could lower consumer spending meaningfully and, in turn, weigh on inflation.
Endnotes
-
1
Specifically, we run an ordinary least squares regression from 1978 to 2019. On the left-hand side, we use year-over-year real consumption growth; on the right-hand side, we use year-over-year real disposable personal income growth, an index for the University of Michigan readiness to spend on household durables, the 12-month lag of real excess savings per household as a percent of real disposable personal income per household, and an index for the University of Michigan current business conditions compared with one year ago (all monthly data). Before running the regression, we demean all variables. We calculate predicted consumption for 2022:Q2 and 2022:Q3 using current data for our right-hand-side variables and the coefficients from this regression. Because we demean all variables, we add back in average consumption growth from 1978 to 2019. The R2 is 0.66, and all independent variables are statistically significant at the 1 percent level, meaning they are both economically and statistically significant predictors of consumer spending growth. Moreover, we use our regression coefficients to create a predicted consumption growth series for 1978 to the present. The correlation between our predicted series and actual consumption growth from 1978 to 2019 is 0.81.
-
2
Current business conditions index makes a small negative contribution to predicted growth (grey bars). Data for 2022:Q3 are advance estimates released in late October. Contributions in 2022:Q1 tell the same story, with a negative predicted value for consumption growth. Other factors not captured in our estimation, such as elevated wealth held by households, the unusually tight labor market, or negative real interest rates, could be contributing to robust actual consumption growth.
-
3
We consider average consumer spending sentiment from March 2019 through February 2020, when average consumption growth was quite similar to 2022:Q3.
Nida Çakır Melek is a senior economist, and Emily Pollard is an assistant economist at the Federal Reserve Bank of Kansas City. A. Lee Smith and Johannes Matschke provided helpful comments. The views expressed are those of the authors and do not necessarily reflect the positions of the Federal Reserve Bank of Kansas City or the Federal Reserve System.