Agricultural real estate values in the Tenth District remained resilient through the end of 2023. The value of nonirrigated farmland in the region grew around 10% from a year ago despite sharply higher interest rates and a moderation in farm income and credit conditions. Capital spending slowed, however, alongside higher rates and lower farm income. Demand for farm loans picked up for a growing share of lenders at the end of 2023, as lower crop prices and relatively stable production expenses have squeezed margins for some farm borrowers.
The farm economy continued to moderate alongside lower crop prices, but elevated cattle prices and strong farmland values have provided some stability for the sector. At the end of 2023 and beginning of 2024, production forecasts for the current crop year have weighed on crop prices. Prices for corn, soybeans, and wheat declined steadily throughout the fourth quarter, contributing to lower farm incomes compared to a year ago. Cattle prices have stabilized at high levels alongside historically low inventories, and despite recent concerns related to crop markets, demand for good quality cropland remains robust, supporting real estate values.
Section 1: Farmland Markets and Interest Rates
Despite lower commodity prices and higher interest rates, growth in farmland values remained firm through the end of 2023. Nonirrigated farmland values across the District increased at a steady pace, while the pace of growth in irrigated farmland and ranchland values slowed slightly (Chart 1). Alongside a drop in crop prices, contacts across the District reported some financial strain from increased expenses and lower revenues, but values for all types of farmland still grew by about 8 percent, on average, from the previous year.
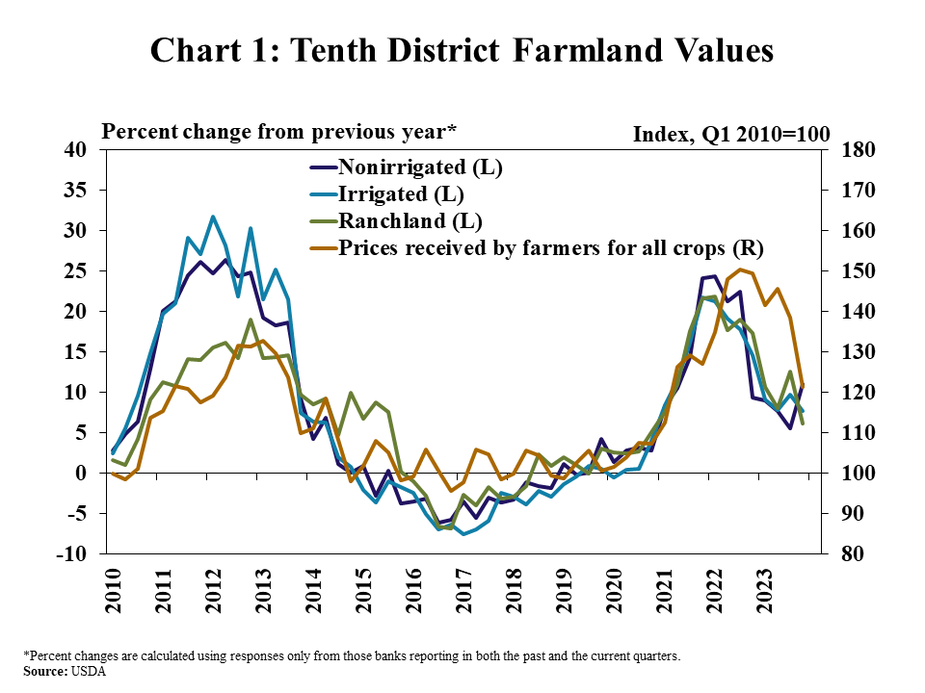
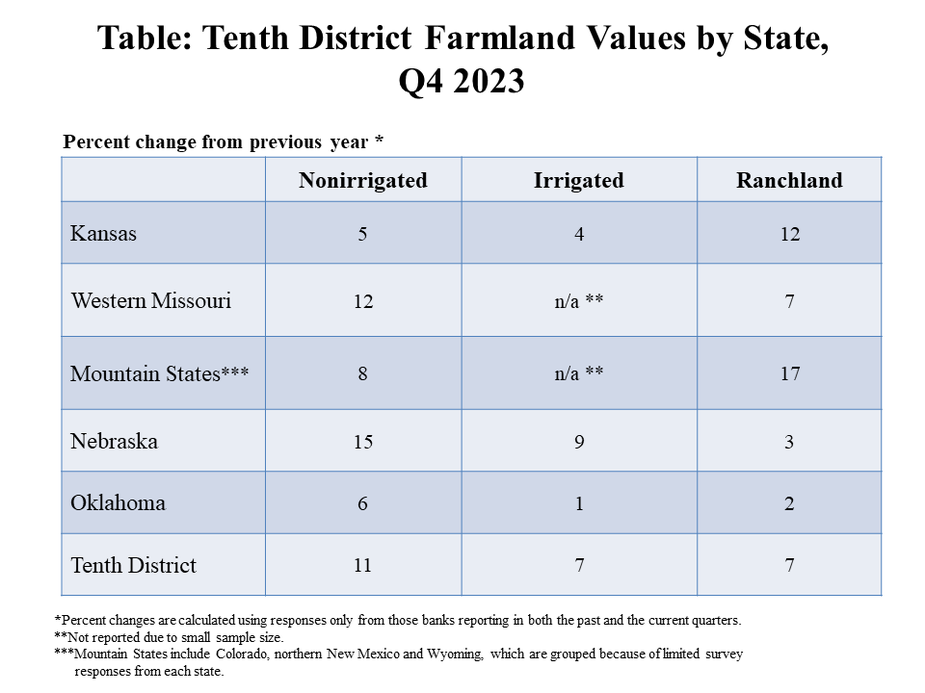
Farmland values remained resilient but varied throughout the District. Increases in nonirrigated land values were particularly high in Western Missouri and Nebraska (Table). A Nebraska contact reported that land values have remained high alongside strong demand for cropland. Irrigated cropland and ranchland values increased at a slower rate in Oklahoma, as contacts there reported slight shifts in demand to land for recreation and other investment opportunities amid higher interest rates and lingering drought in some areas.
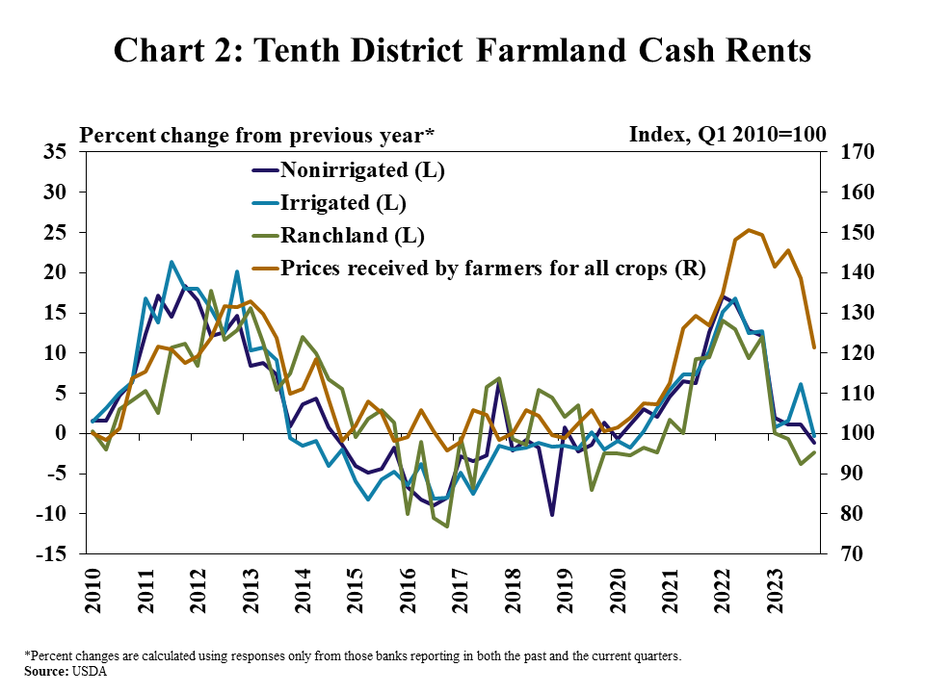
Cash rents steadied despite further growth in farmland values. Average cash rents on ranchland inched downward from a year ago during the second half of 2023 while nonirrigated and irrigated rents were largely unchanged (Chart 2). Contacts in Kansas, Nebraska, and Oklahoma reported strong prices and revenues for cattle producers that assisted with stabilizing ranchland cash rents. However, contacts in Nebraska and Kansas reported farmers having less cash on hand, but strong asset values, both of which affect farmers ability to rent nonirrigated and irrigated land.
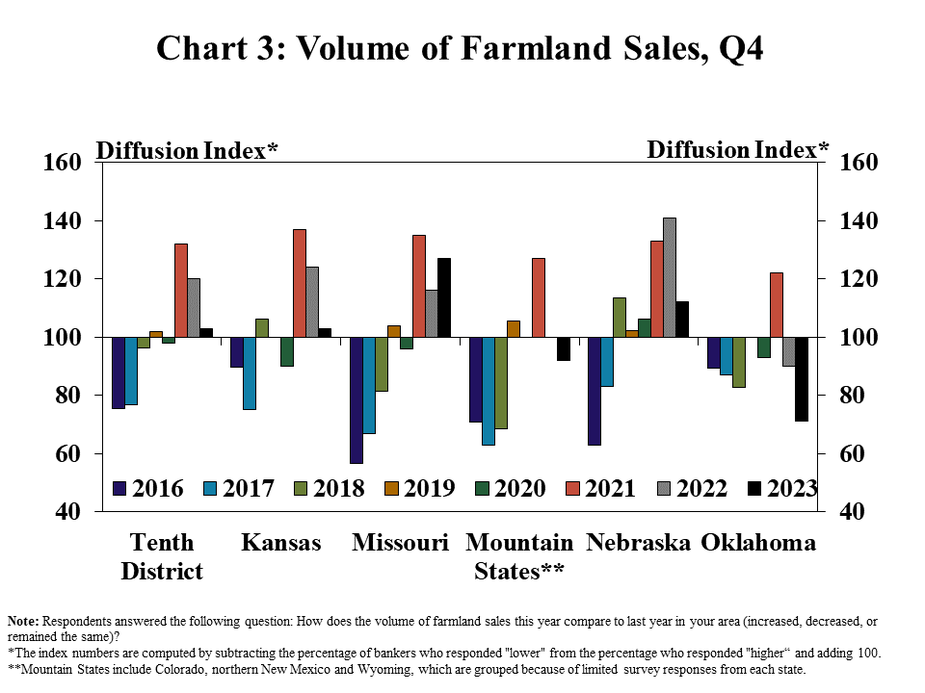
A slowdown in the amount of farmland on the market across the District may have contributed to some of the resiliency in farmland values. Farmland sales slowed across the region and in all states except Missouri where sales increased slightly from a year ago (Chart 3). The volume of farmland sales slowed the most in Oklahoma, where 45 percent of respondents reported that farmland sales were lower than a year ago. Overall, it appears that most of the slowdown was due to limited amounts of land being placed on the market, not because of a slowdown in demand.
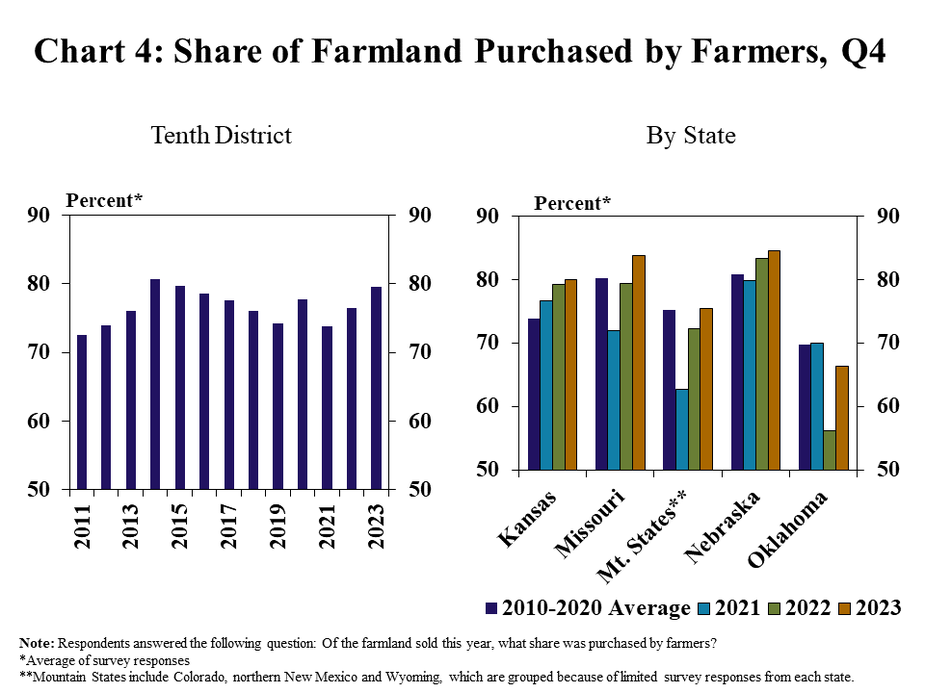
Demand for land also has remained strong as the share of farmland purchased by farmers increased across the District. The share of farmland purchased by farmers continued to increase to almost 80 percent, the highest since 2015 (Chart 4). In addition, the share of farmland purchased by farmers grew in every state, and some agricultural lenders commented that they have continued to see farmland buyers with ample funding available.
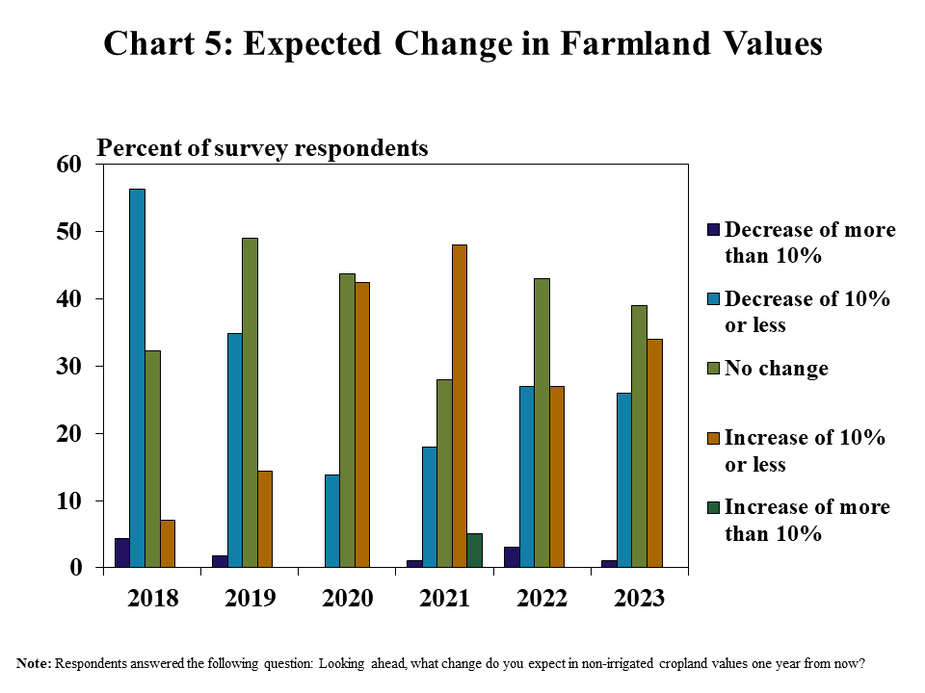
Most agricultural lenders expected farmland values to remain stable in 2024, and a large share still expected an increase in the coming year. More than 70 percent of survey respondents expected farmland values to increase moderately or remain unchanged (Chart 5). Moreover, fewer lenders expected a substantial decline in farm real estate markets coming into this year.
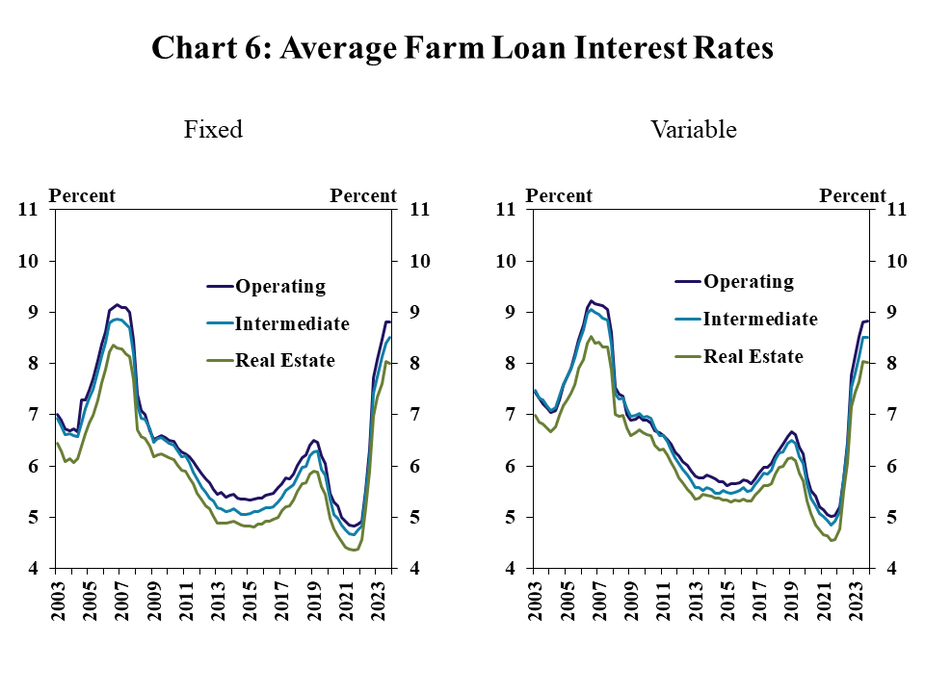
Expectations for farmland values remained optimistic despite increased costs and risks associated with higher interest rates. Interest rates on all types of loans leveled off in the fourth quarter but remained at elevated levels (Chart 6). Rates were more than a full percentage point higher than average rates last year and stayed between 8 and 9 percent. Alongside higher interest rates, interest costs on farmland loans have increased dramatically, but the effects on farm real estate markets have been fairly muted so far.
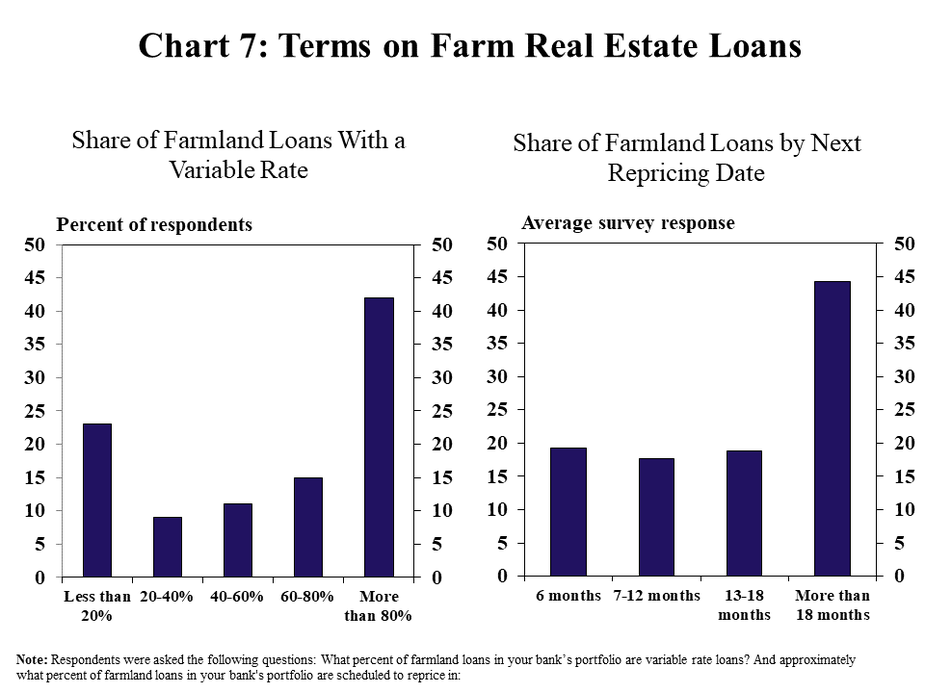
One risk to the outlook for land markets is that a large share of farmland loans could reprice at higher interest rates in coming months. At the end of 2023, nearly half of respondents reported more than 80 percent of farmland loans with variable interest rates in their bank’s portfolios (Chart 7). Another quarter of respondents reported at least 40 percent of farmland loans with variable interest rates. Of these loans with variable rates, almost 20 percent were scheduled to reprice in the next six months. About 45 percent of farmland loans had repricing schedules of 18 months or more. However, farm borrowers whose loans were written with shorter terms could face much steeper interest expenses when those loans reprice since interest rates have recently become much higher than they would have been on any loans originated in the last decade.
Section 2: Farm Income and Credit Conditions
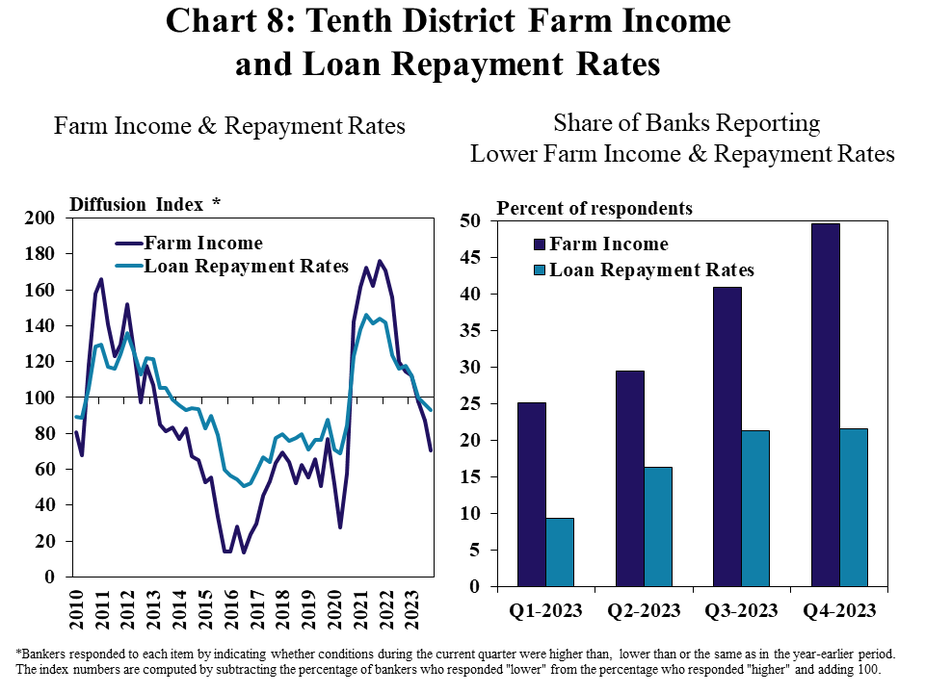
Farmland values also held firm despite a moderation in farm income and credit conditions. The pace of decline in farm income was faster than recent quarters, as the share of respondents reporting farm income was lower than a year ago neared 50% (Chart 8). Farm loan repayment also softened alongside farm income, and the share of respondents reporting lower rates of repayment grew to 20% in the fourth quarter.
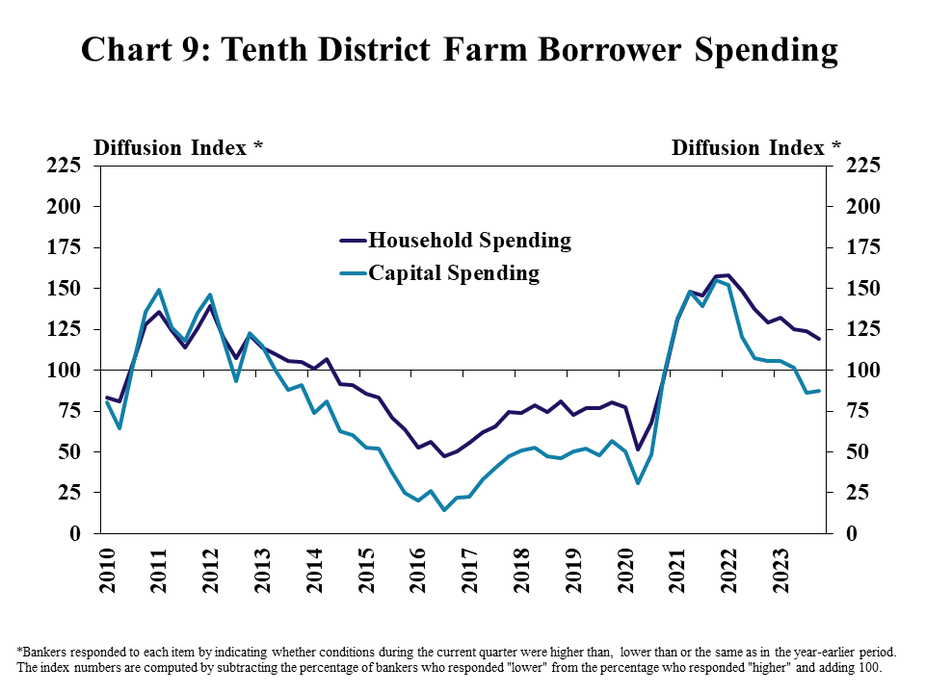
Capital spending by borrowers slowed alongside farm income, while household spending grew steadily. Alongside a moderation in farm incomes and higher interest rates, respondents continued to report a pullback in capital spending by farmers (Chart 9). The pace of increase in household spending moderated over the past year but continued to rise steadily.
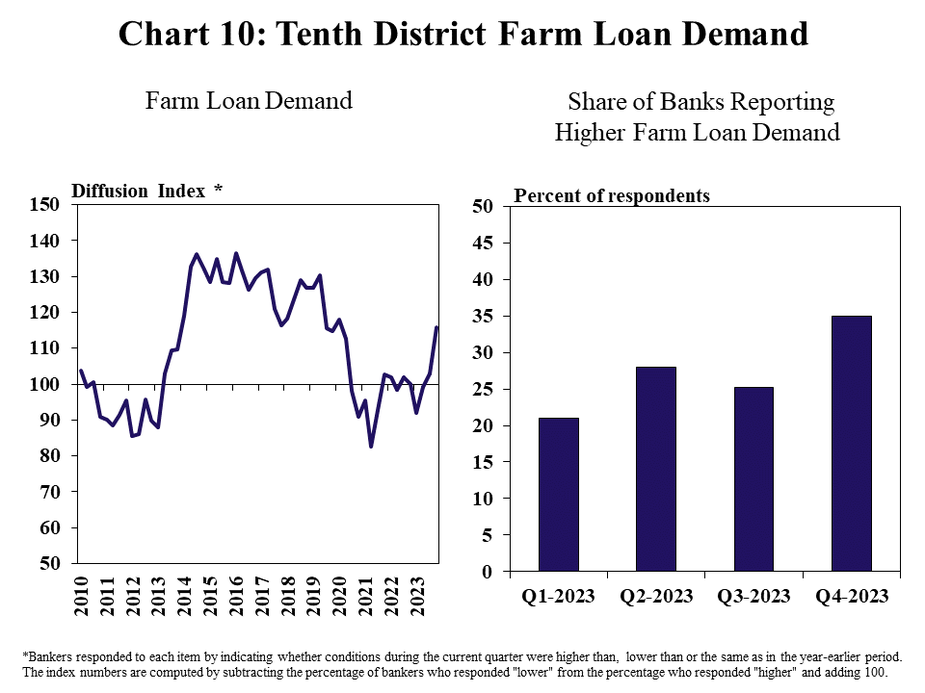
As farm finances moderated, demand for farm loans grew at the fastest pace in nearly three years. Demand for non-real estate farm loans was subdued in recent years alongside financial strength across the sector, but showed signs of picking up in the fourth quarter (Chart 10, left panel). Farm borrower liquidity has declined over the past year and the share of banks reporting higher loan demand than a year ago reached the highest level since 2019 (Chart 10, right panel).
Banker Comments Q4 2023
“Interest expenses in 2023 were two times what was paid in 2022, while expenses for fuel, chemicals, seed, feed and fertilizer were still high, which made it very tough for farm borrowers to show a profit.”– Northern Colorado
“Real estate values are holding steady. Liquidity is higher than usual, but expenses also are higher, so liquidity burns faster.”– Northern Wyoming
“A severe hailstorm destroyed several corn crops in the area in July. The beans and milo came back and yielded well.” – Central Kansas
“We renew all operating loans every six months.” – Western Kansas
“Lower commodity prices for 2023 crops have reduced margins drastically from the past couple years. This is being offset some with reduced fertilizer costs for the 2024 crop.” – Western Kansas
“Drought and lower corn prices made things tighter for grain farmers. Many are taking crop insurance proceeds. All of this, coupled with high interest rates, has caused a lot of uncertainty, and farmers seem to be getting more conservative with capital spending.” – Central Kansas
“Cattle prices being up have helped farmers with cattle tremendously but also have caused the replacement of cows in the herd to be much more costly.” – Central Kansas
“Cattle margins were very strong for much of 2023, but high volatility in the last 90 days has reduced margins and will be something to monitor closely going forward.” – Western Kansas
“Land sales may be leveling-off, but I don't expect values to decrease. There are still farmland buyers with funding available.” – Central Missouri
“Land prices remain on an upward trend yet. In our region, there are several large landowners who also farm that continue to be the main buyers of whatever comes up for sale.” – Eastern Nebraska
“Liquidity to make farm loans remains a significant challenge. With lower commodity prices this year, farmers will borrow more next year.” – Western Nebraska
“Cow and calf prices are high, so our ranchers are selling everything they can. They will be very profitable this year.” – Western Nebraska
“Farmland purchased by farmers and ranchers is at an all-time low. When farmland is sold, it typically gets converted to recreational land. Farmers can't afford to pay the current market price for real estate and make it work.” – Southern Oklahoma
“With higher CD rates, some investors are less interested in purchasing land.” - Northern Oklahoma
“As interest rates have creeped higher, capital spending is still high for farmers. Farm income is not keeping pace with spending.” – Western Oklahoma
A total of 128 banks responded to the Fourth Quarter Survey of Agricultural Credit Conditions in the Tenth Federal Reserve District—an area that includes Colorado, Kansas, Nebraska, Oklahoma, Wyoming, the northern half of New Mexico and the western third of Missouri. Please refer questions to Cortney Cowley, senior economist, Jannety Mosley, senior survey analyst or Ty Kreitman, associate economist at 1-800-333-1040.
Data: Excel SpreadsheetCredit Conditions | Excel SpreadsheetFixed Interest Rates | Excel SpreadsheetVariable Interest Rates | Excel SpreadsheetLand Values
A total of 128 banks responded to the Fourth Quarter Survey of Agricultural Credit Conditions in the Tenth Federal Reserve District—an area that includes Colorado, Kansas, Nebraska, Oklahoma, Wyoming, the northern half of New Mexico and the western third of Missouri. Please refer questions to Cortney Cowley, senior economist, Jannety Mosley, senior survey analyst or Ty Kreitman, associate economist at 1-800-333-1040.
The views expressed are those of the authors and do not necessarily reflect the positions of the Federal Reserve Bank of Kansas City or the Federal Reserve System.