Agricultural credit conditions in the Tenth District moderated in the second quarter and farmland values continued to increase. Following multiple years of considerable improvement, farm income softened, and borrower liquidity retracted somewhat alongside continued cost pressures and lower prices for most agricultural commodities compared to a year ago. Although cost increases have been more modest in 2023 than last year, many agricultural lenders expected loan demand to increase and repayment rates to decline in coming months. Despite sharp increases in interest rates and a notable slowdown in cash rents, farmland values still grew at a strong pace.
Despite some moderation, the Tenth District's farm economy was steady in the second quarter. Drought early in the quarter followed by heavy rains later contributed to difficulty with winter wheat harvest and spring planting. Some agricultural bankers commented that decreased grain prices, weather volatility, and stable production expenses could reduce borrower liquidity that had been very strong during renewal season. Higher interest rates have also increased borrowing costs for farmers, but loan demand has remained stable, and bank liquidity remained sound despite a slight pullback in deposit balances.
Credit Conditions
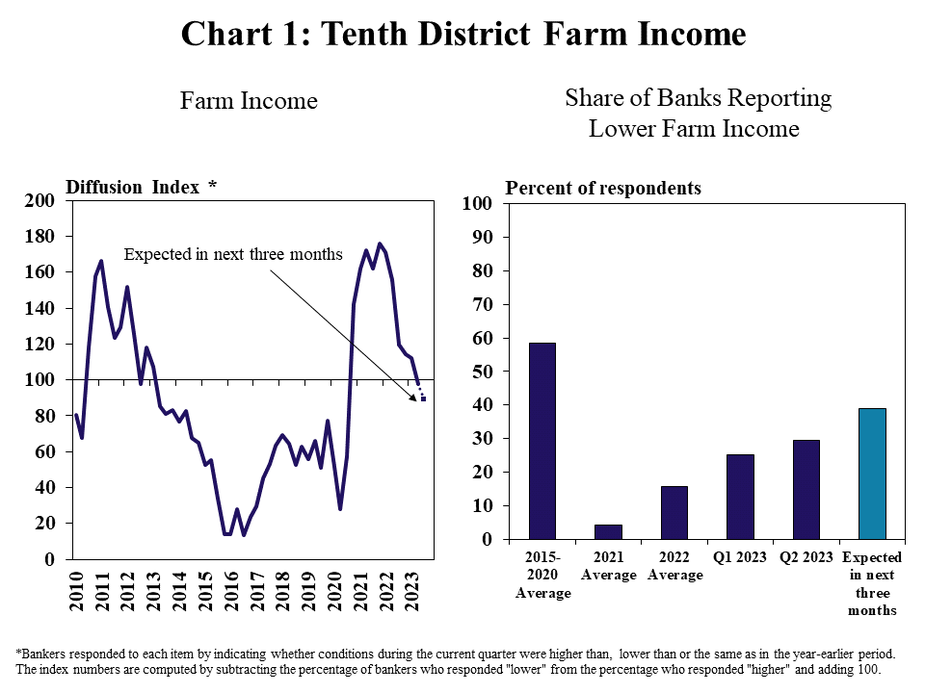
Farm incomes in the Tenth District have moderated alongside more tempered conditions in the agricultural economy. The changes in farm income across the region were flat in the second quarter following two years of considerable strength (Chart 1). The share of lenders reporting that farm incomes were lower than a year ago rose for the fourth consecutive quarter, and more than a third of respondents anticipated weaker conditions than last year in the next three months.
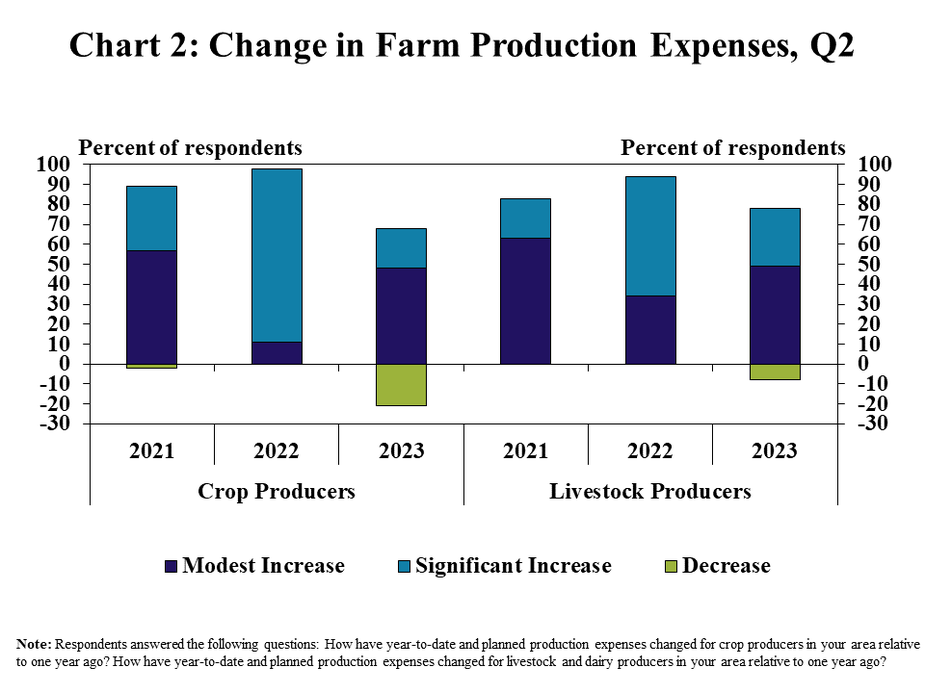
Income growth has flattened alongside elevated production expenses, but cost pressures showed signs of easing. Well over half of respondents reported that production expenses for all types of producers continued to increase, but the degree of increase was notably more modest than last year (Chart 2). Costs for crop farmers declined in the lending areas of 20% of banks, while reductions in costs for livestock producers were more limited.
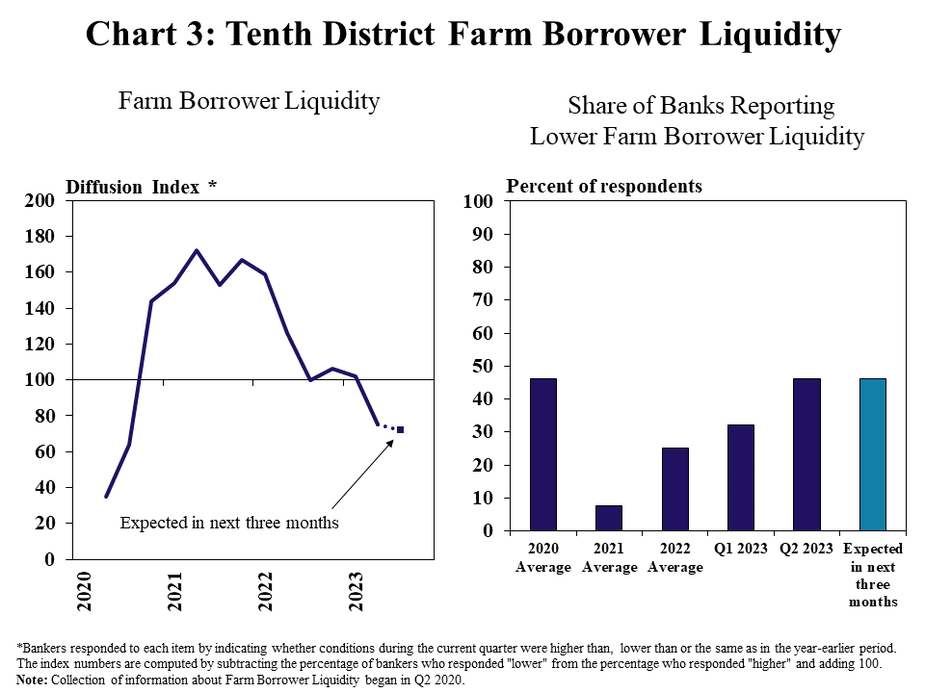
Expense pressures and a moderation in commodity prices have reduced farm liquidity in the region. Farm borrower liquidity declined at a moderate pace in the second quarter for the first time since 2020 (Chart 3). Nearly half of respondents reported that producer cash reserves were less than the same time a year ago, and a similar rate of deterioration was expected in the next quarter.
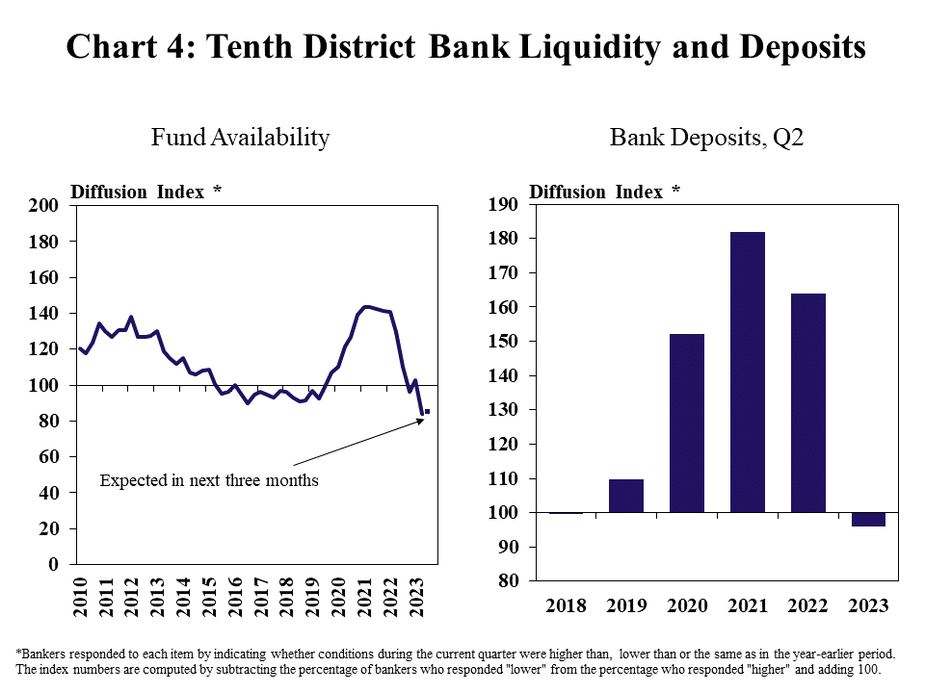
Bank liquidity has also retracted slightly in recent months as deposit growth has eased. Availability of funds declined at a modest pace in the second quarter following significant growth the past 2 years (Chart 4, left panel). Deposit balances were less than a year ago for many lenders, but liquidity at agricultural banks has remained sound following several years of strong deposit growth and subdued loan demand (Chart 4, right panel).
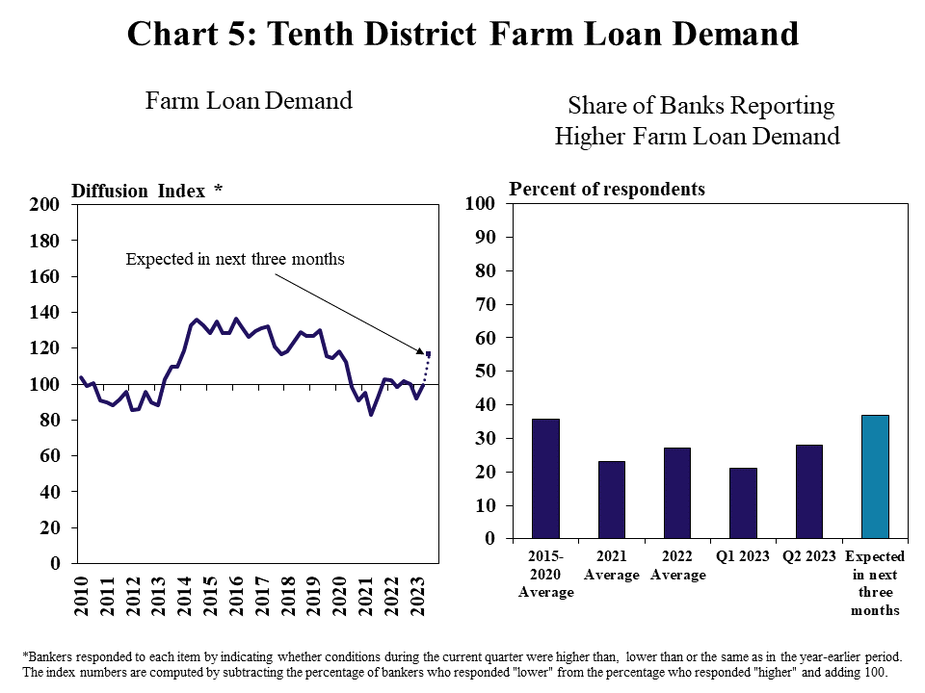
Loan demand in the District remained flat, but some bankers continued to expect a rebound alongside elevated costs and recent liquidity depletion. Demand for non-real estate farm loans was nearly unchanged across the region, with roughly a quarter of banks reporting increases and decreases from a year ago (Chart 5). Higher production costs have pushed up credit needs for some borrowers, while many others have utilized cash holdings to supplement loan balances and reduce interest expenses.
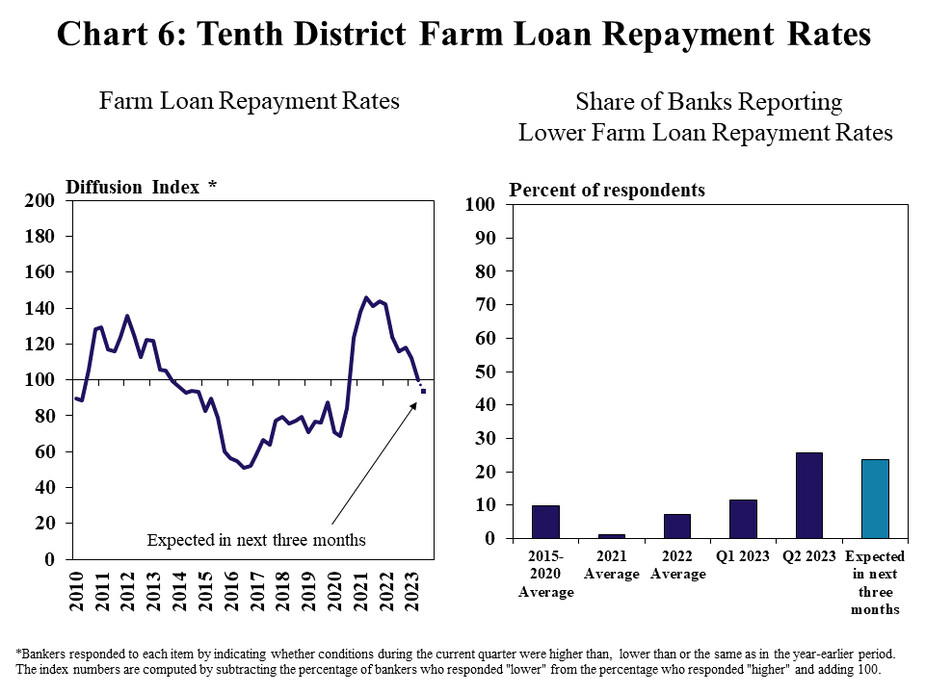
Similar to farm income, improvement in farm loan repayment rates has also moderated in recent months. Changes in farm loan repayment rates were flat in the second quarter following considerable improvement during recent years (Chart 6). The share of banks reporting slower repayment reached the highest level since 2020 and a similar share expected some slowing in the months ahead.
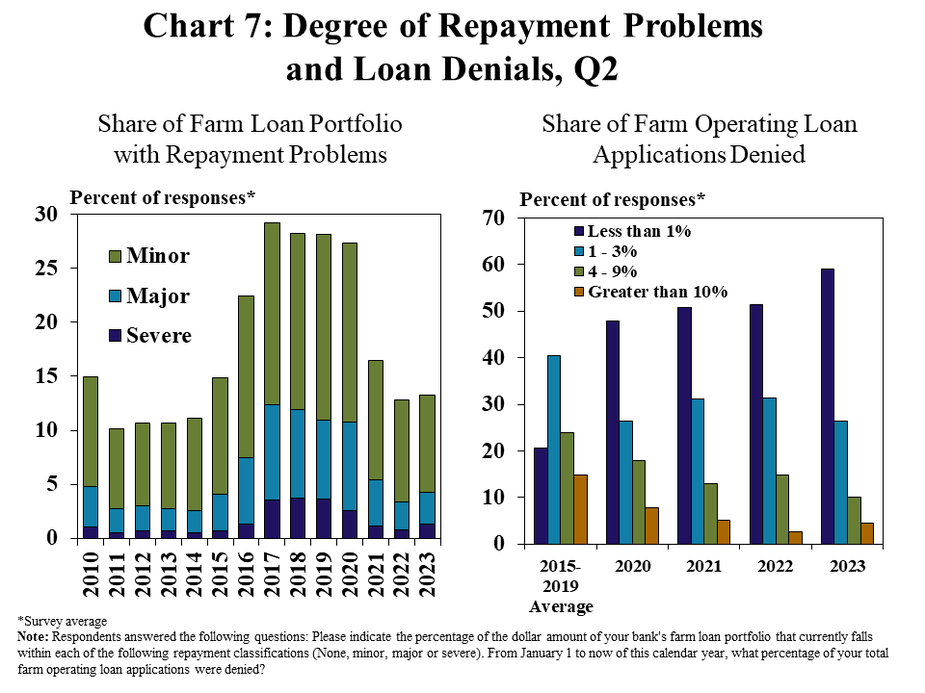
The degree of repayment issues, however, remained marginal through the second quarter. On average across the District, fewer than 15% of all farm loan balances had repayment problems and the vast majority of issues were considered minor (Chart 7). The broad strength in agricultural credit conditions also kept the rate of denials on farm operating loans at historically low levels.
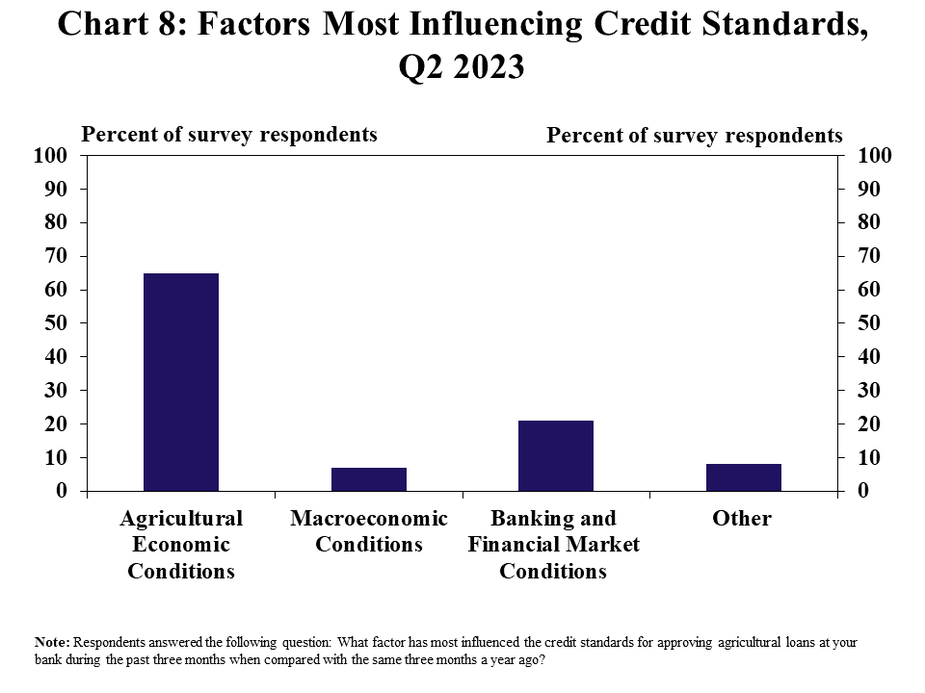
Conditions in the farm economy remained the primary factor for determining credit standards for agricultural borrowers, but banking and financial market conditions were more important for some lenders. About two-thirds of respondents indicated that agricultural economic conditions were the most influential factors in agricultural loan application decisions (Chart 8). A smaller, but sizable 20% of banks considered broader banking and financial market conditions the most important factor.
Interest Rates and Farmland Values
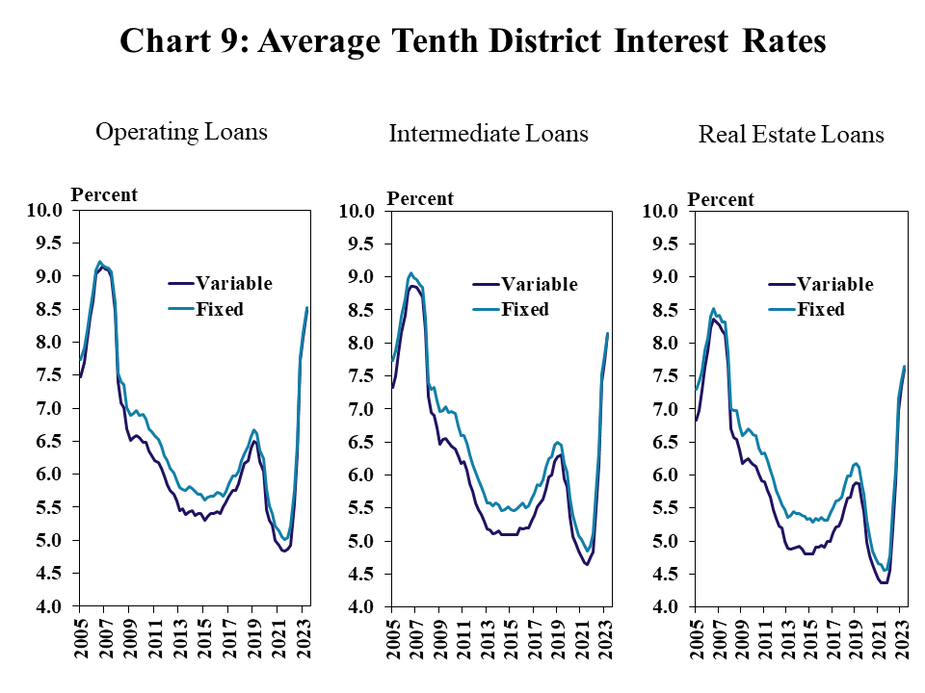
Average interest rates increased from the previous quarter alongside further increases in the federal funds rate, and the spread between variable and fixed rates narrowed. In the second quarter, interest rates on operating and intermediate loans increased by about 40 basis points from the previous quarter, and rates on real estate loans were more than three percentage points higher than in 2021 (Chart 9). Fixed rates have historically been higher than variable rates, particularly during periods of rate reduction, however, variable and fixed rates were nearly equal for all loan types in the second quarter.
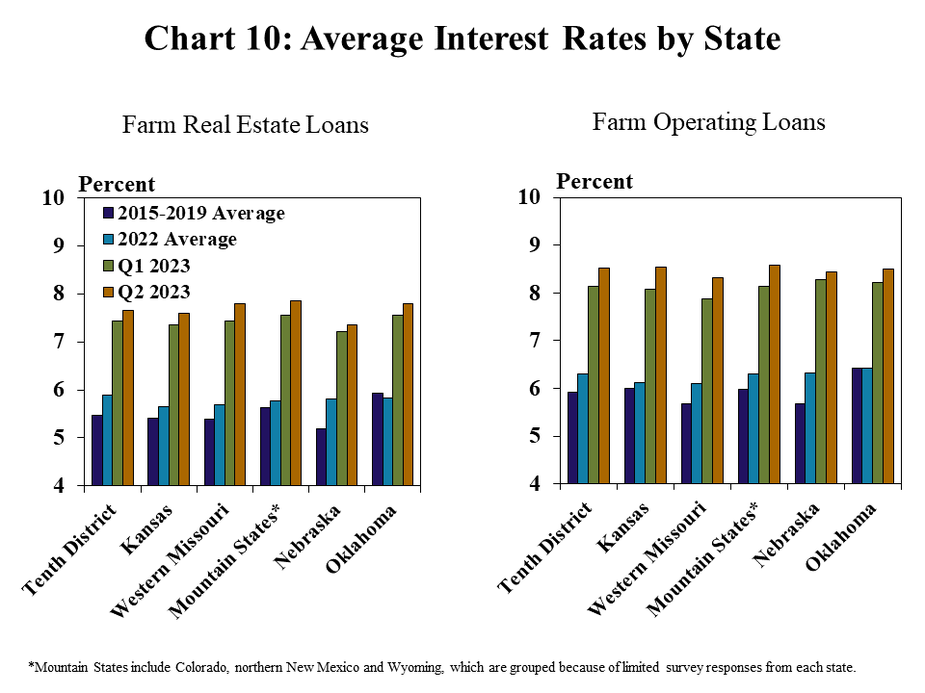
Interest rates on farm real estate and operating loans have grown rapidly across all states. Last year, average interest rates were slightly above the pre-pandemic average in most states (Chart 10). In Oklahoma, average rates on farm real estate loans were slightly below the average from 2015 to 2019. However, the rate environment in 2023 has changed notably for farm borrowers, as interest rates on operating loans rose above 8 percent, on average, in all states in the second quarter.
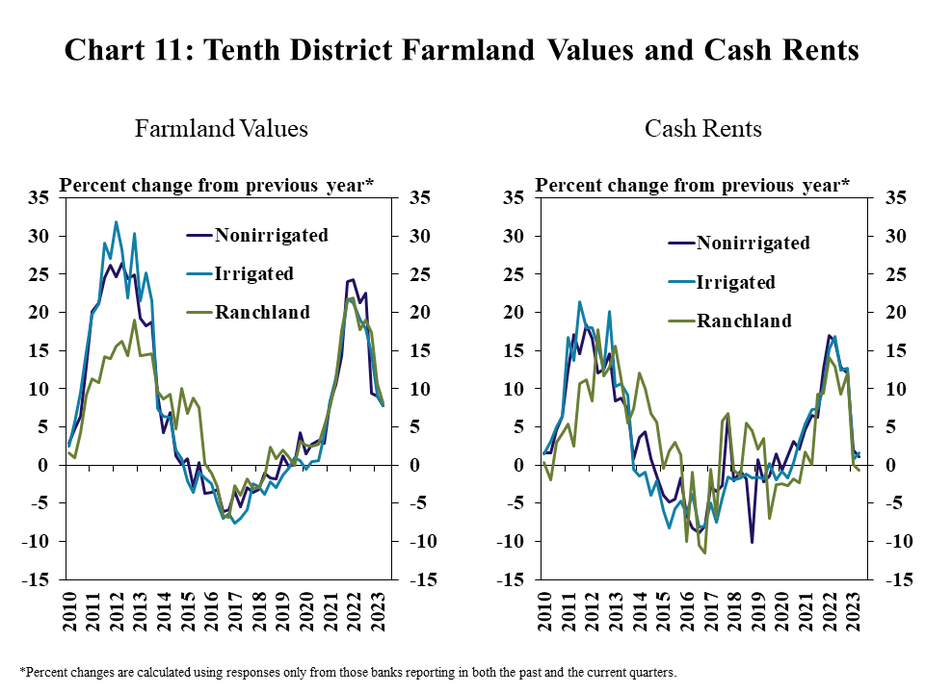
Growth in farm real estate values remained relatively strong despite the rapid rise in interest rates and some moderation in the farm economy. Values for all types of farmland grew by almost 8 percent in the second quarter (Chart 11). Although the average rate of growth for nonirrigated cropland declined from more than 20 percent a year earlier, continued strength in farmland markets has occurred alongside more pronounced softening in cash rents. Cash rents for ranchland declined slightly for the first time since 2020 in the second quarter, and rents for cropland increased by only 1 percent.
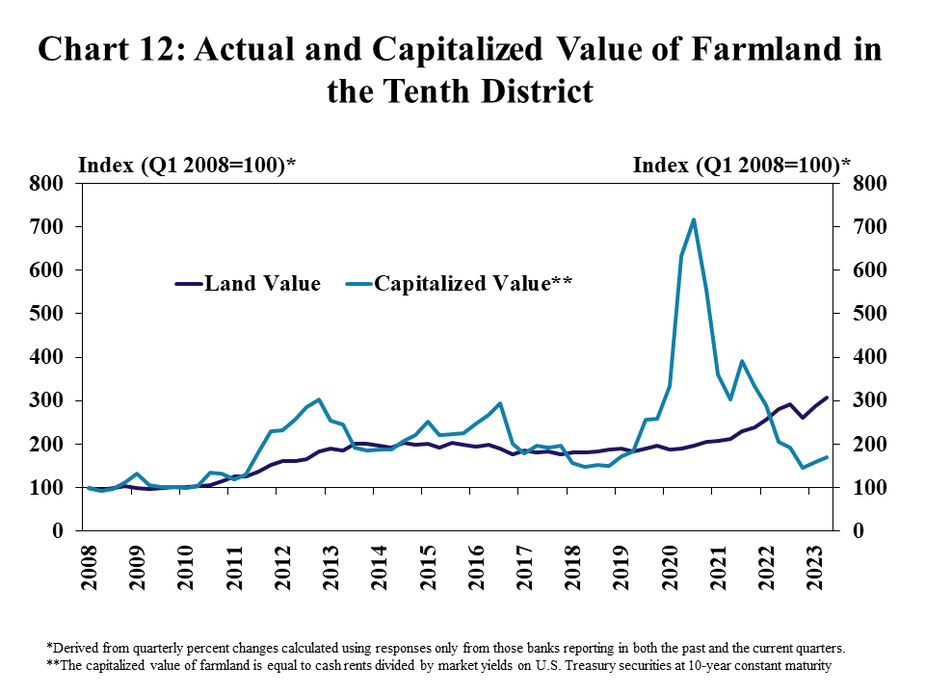
Considerable strength in farmland markets has pushed values above what may be expected given the current interest rate environment and prospects for financial returns from cash rents. Reported values of farmland in the District have continued to rise steadily in recent months as the estimated value based on the relationship between cash rents and benchmark interest rates (capitalized value) has dropped considerably (Chart 12). Capitalization values provide a way to evaluate the combined effects of interest rates and returns_and have declined alongside the rapid increase in interest rates and a moderation in cash rents. Some moderation in farmland values could be expected given these downward pressures, particularly for more marginal or less productive tracts, however, a steady supply of land sales and strong demand from farmers has likely supported broad resiliency of real estate values.
Banker Comments Q2 2023
“Our area has been severely impacted because of wildfire last year and this year. It is really hard to predict the future of land values along with cattle sales because ranchers are having to sell their herds because of the fires.”– Northern New Mexico
“Drought conditions are making for a poor wheat harvest. Rains lately have helped the spring crop potential.”– Southwest Kansas
“Prospects for an average to good fall harvest are looking better with recent rains, but higher interest rates and increased production costs are not helping and cattle sales have been reduced as many head were sold due to drought and not carried through winter.”– Central Kansas
“With the 60-year low cattle inventory, this market is expected to stay strong and anyone with grass is buying cattle with expectations of increased prices later this fall.”– Northcentral Kansas
“Most farmers are in a good financial condition; however, drought will affect everyone to some degree with higher input costs, high interest rates and a severe drought are making this a tough year, but most farmers will work through it.”– Central Missouri
“The drought is hitting us hard. We are seeing several cow-calf operators reducing herd size due to lack of hay production.”– Southwest Missouri
“Drought conditions locally have caused forage concerns for beef cattle producers and will be a big limiting factor going forward for those producers when determining whether to expand or reduce herd numbers.”– Northwest Missouri
“Livestock producers are very optimistic with significantly higher calf prices this spring and early summer and crop producers are cautiously optimistic with grain prices currently presenting an opportunity to market crop at very profitable levels.”– Northcentral Nebraska
“At renewal time, farm customers had excellent balance sheet liquidity. Three to six months later, however, with decreased grain prices and dryness in our area, it is possible that a noticeable amount of this liquidity could erode.”– Northeast Nebraska
“Land values are remaining high with good demand for cropland. Higher interest rates don't seem to be affecting our local economy at this time.”– Southcentral Nebraska
“Interest rates, equipment costs, and operating expenses - especially fuel, fertilizer, feed, and practically all operating expenses have placed increased pressure on farm/ranch profitability.” – Southeast Oklahoma
“Rising costs for feed and fertilizer are major concerns for our area and overall market conditions are increasing costs for stockers.” – Southwest Oklahoma
“Higher interest rates have increased expenses for farmers and in turn they are borrowing less money.” – Southeast Oklahoma
Endnotes
-
1
Schnitkey, G., C. Zulauf, K. Swanson, N. Paulson, J. Baltz and J. Coppess. "External LinkFarmland Prices Higher but Still in Line with Market Fundamentals." farmdoc daily (12):121, Department of Agricultural and Consumer Economics, University of Illinois at Urbana-Champaign, August 16, 2022.External LinkPermalink
Data: Excel SpreadsheetCredit Conditions | Excel SpreadsheetFixed Interest Rates | Excel SpreadsheetVariable Interest Rates | Excel SpreadsheetLand Values
A total of 136 banks responded to the Second Quarter Survey of Agricultural Credit Conditions in the Tenth Federal Reserve District—an area that includes Colorado, Kansas, Nebraska, Oklahoma, Wyoming, the northern half of New Mexico and the western third of Missouri. Please refer questions to Cortney Cowley, senior economist or Ty Kreitman, assistant economist at 1-800-333-1040.
The views expressed are those of the authors and do not necessarily reflect the positions of the Federal Reserve Bank of Kansas City or the Federal Reserve System.