Farm debt balances at commercial banks grew steadily in the third quarter but loan performance remained strong. Despite some indications of slower lending activity in recent surveys and subdued loan demand for some lenders, outstanding debt at commercial banks in aggregate grew at a pace similar to the past year. Alongside ongoing strength in farm finances, delinquency rates on agricultural loans dropped for the third consecutive year and remained at historically low levels.
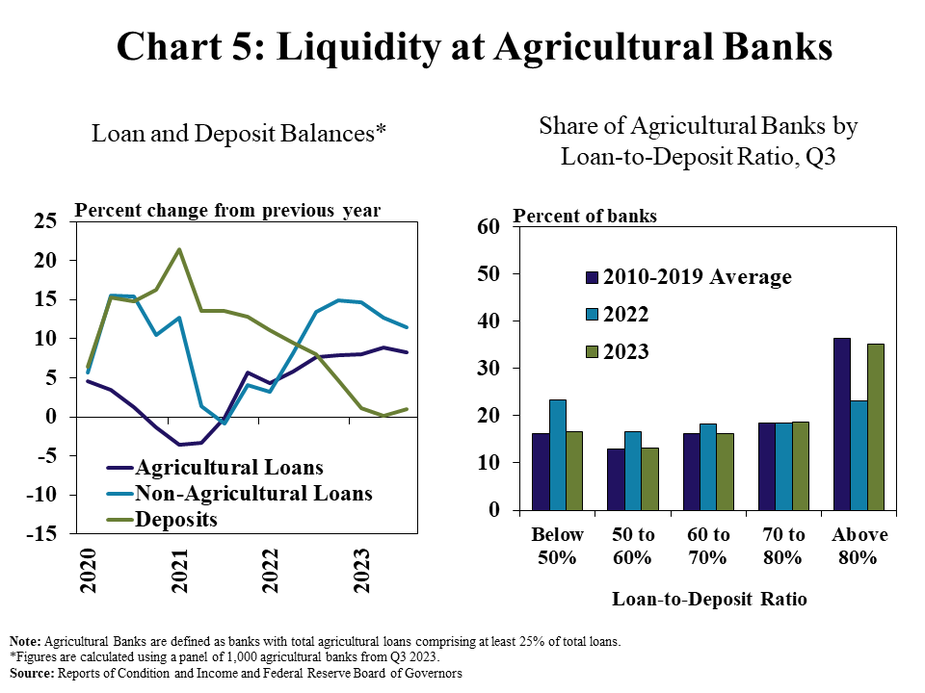
Steady loan growth has coincided with a pullback in deposit growth and firmed liquidity at agricultural banks. Higher interest rates have induced greater competition for deposits, pushed up costs of funding and compressed net interest margins slightly in recent months. Profits for agricultural banks, however, have stayed solid with support from higher interest income. Sound liquidity has continued to ease much of the risk surrounding elevated levels of unrealized losses at many banks and will remain important going forward.
Third Quarter Commercial Bank Call Report Data
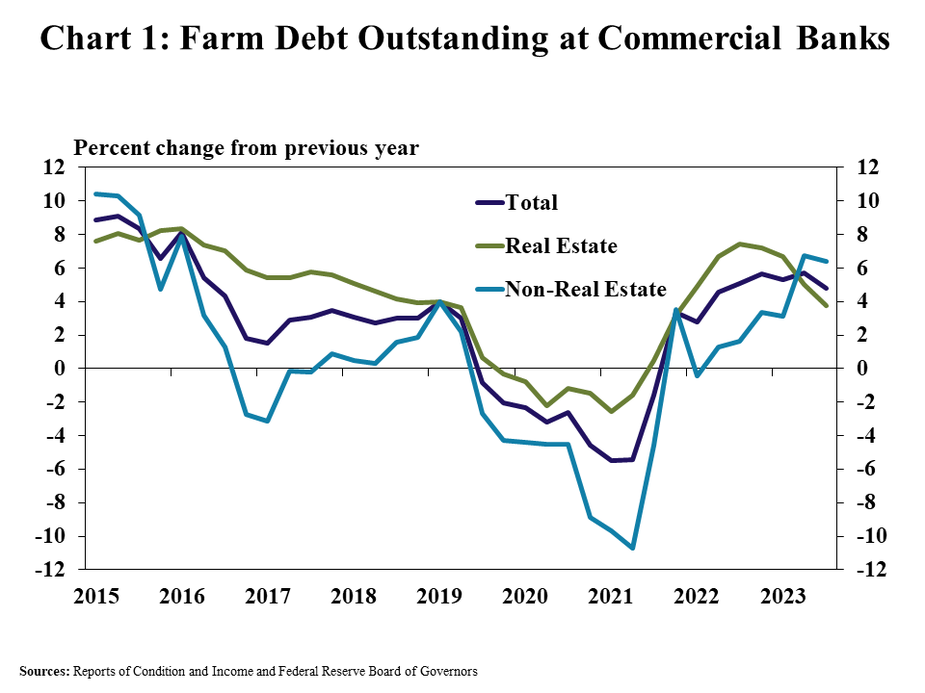
The balance of agricultural debt continued to increase alongside growing demand for production loans. According to commercial bank Call Reports, farm debt was about 5% higher than the same time a year ago and has increased at a similar pace for nearly two years (Chart 1). The pace of growth in non-real estate debt was steady while growth in farm real estate debt was softer than previous quarters.
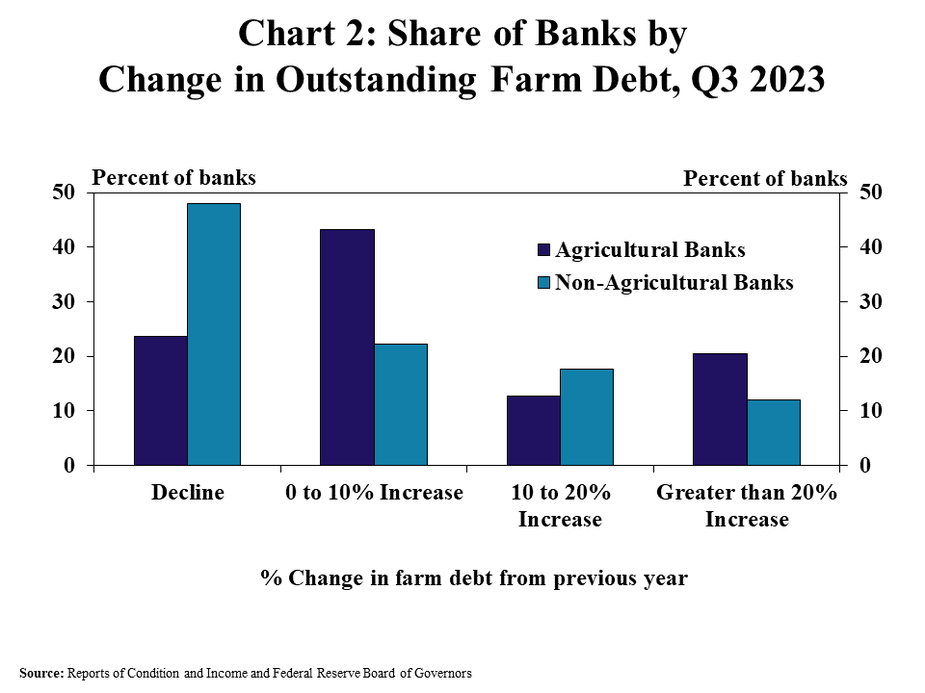
Despite steady growth in total, farm debt remained subdued at some banks while growing considerably for others. Farm loan balances were lower than a year ago for a quarter of agricultural banks and half of non-agricultural banks (Chart 2). Outstanding debt grew by less than 10% for most agricultural banks, but increased more than 10% for a third of lenders.
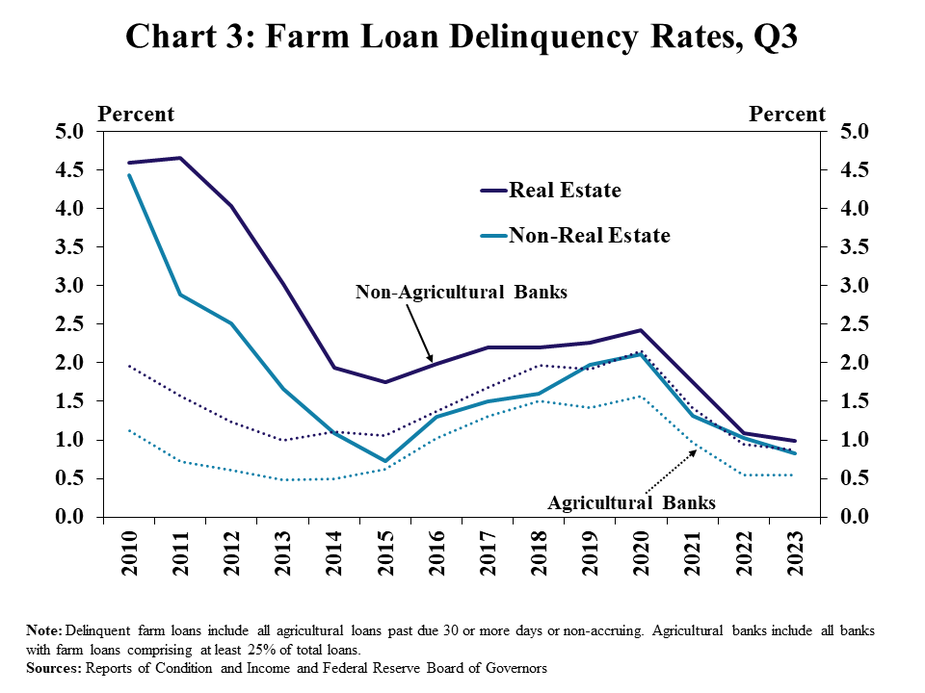
Agricultural loan performance remained strong in the third quarter. Delinquency rates on both real estate and non-real estate farm loans declined for the third consecutive year at both agricultural and non-agricultural banks (Chart 3). Delinquencies dropped to all-time lows on real estate loans and were marginally higher than the all-time low for non-real estate loans.
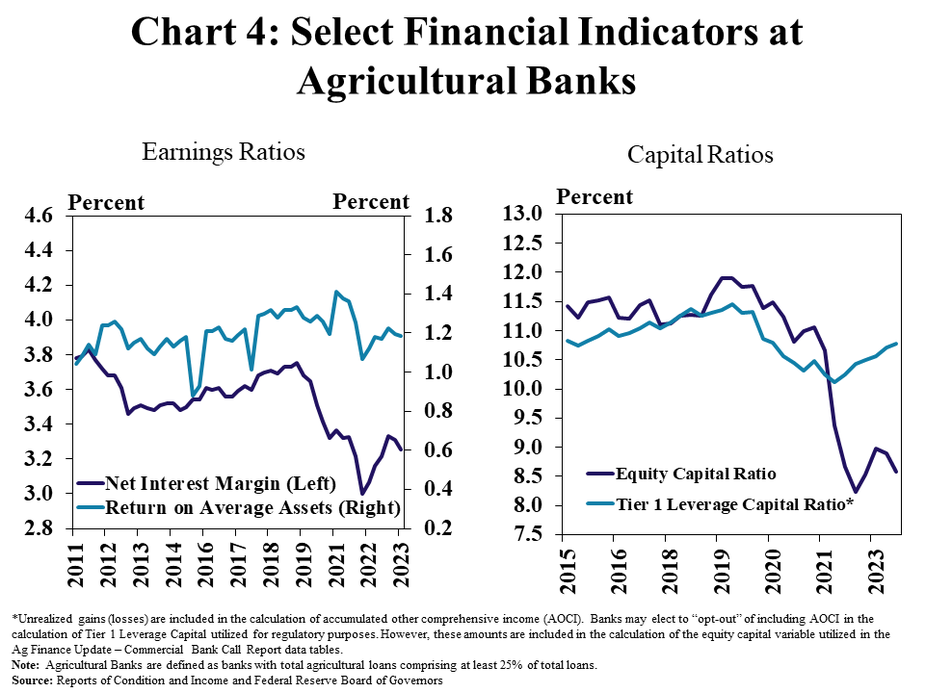
Financial performance at agricultural banks also remained sound, despite some compression in margins and persistently elevated unrealized losses. The return on average assets at agricultural banks remained near the historic average, but was reduced slightly alongside a modest drop in the net interest margin that was squeezed by higher funding costs (Chart 4, left panel). The unrealized losses on investment portfolios remained elevated, but measures of capital excluding those valuations continued to improve (Chart 4, right panel).
Strong loan growth and a dearth of new deposits has tightened liquidity for many lenders. Steady increases in agricultural and non-agricultural loans continued into the third quarter while deposit levels were flat (Chart 5, left panel). In contrast to recent years, with an abundance of liquidity, the share of agricultural banks with loan-to-deposit ratios above 80% increased to the average over the past decade.