Farm lending activity at commercial banks slowed further in the third quarter alongside a drop in operating loan volumes. The number of new non-real estate farm loans was flat compared with a year ago while the average size shrank by nearly 20%. The amount of operating loans over $1 million dropped notably and the reduction in loan size contributed to the third consecutive quarter of declines in non-real estate farm loan volumes. Lending has softened alongside nearly two years of increases in farm loan interest rates that have put considerable upward pressure on financing costs.
The farm economy moderated in recent months as profit margins thinned alongside lower commodity prices and elevated expenses. Credit needs have increased for many borrowers alongside high input costs, but strong liquidity built up in recent years has also allowed many producers to supplement additional loan advances. Similarly, farm debt balances have grown during past quarters according to commercial bank call reports, but a sizable share of lenders have also reported subdued non-real estate loan demand in Federal Reserve District surveys. Considerably higher financing costs have likely prompted borrowers with ample liquidity to limit debt usage, but any softening in farm finances could reduce cash reserves and put upward pressure on lending demand.
Third Quarter National Survey of Terms of Lending to Farmers
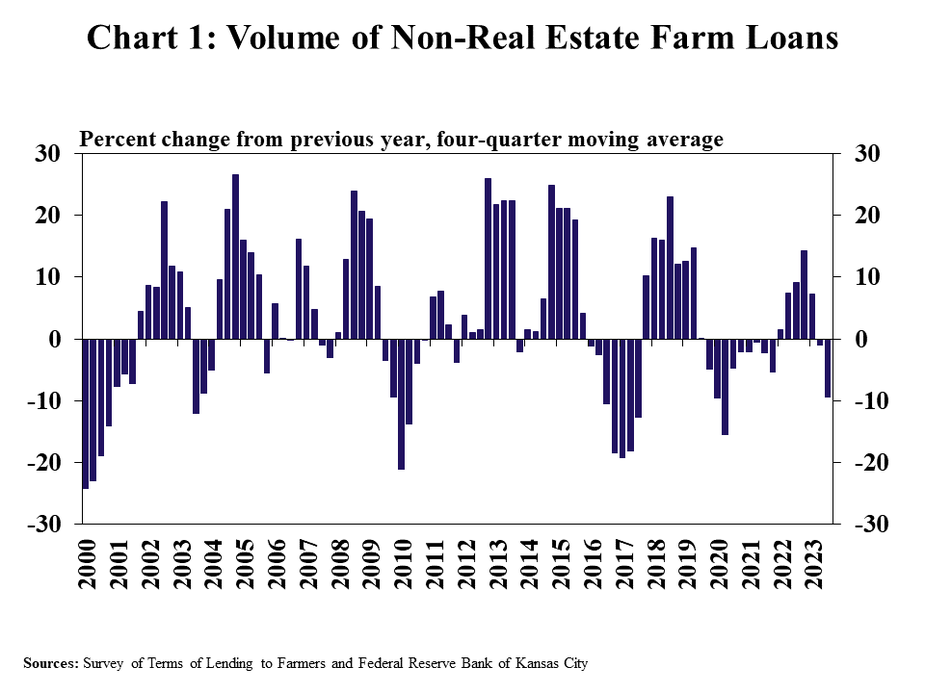
A pullback in lending activity continued into the third quarter. The volume of new non-real estate farm loans at commercials banks dropped for the third consecutive quarter according to the Survey of Terms of Lending to Farmers, declining by an average of 10% over the past year (Chart 1). The decrease was largely attributed to operating loans, while loans for feeder livestock increased notably from a year ago alongside substantially higher cattle prices.
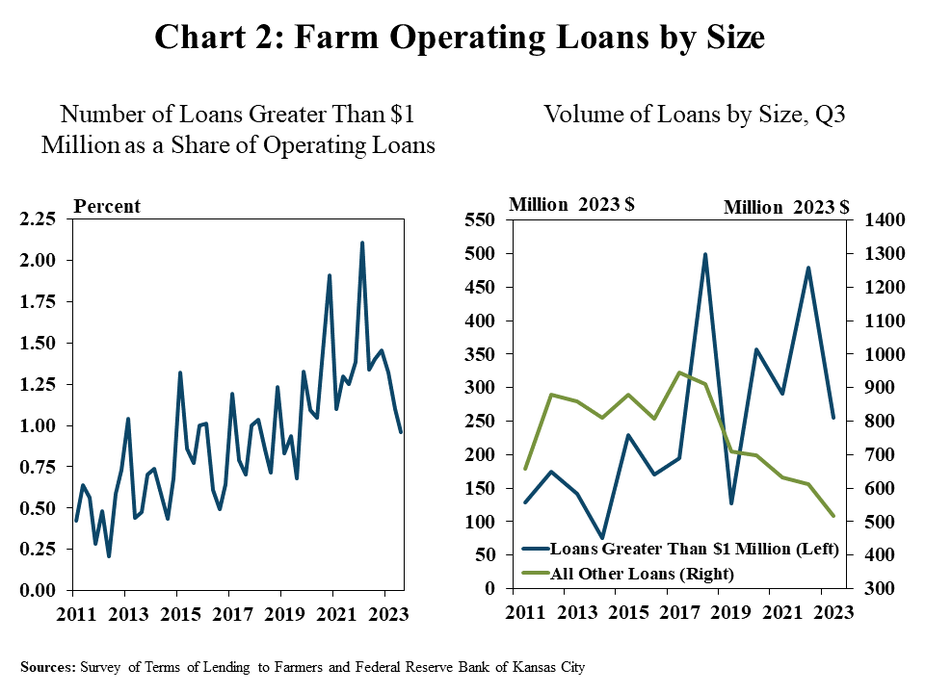
A reduction in large loans pushed lending for operating expenses down. The share of operating loans of amounts greater than $1 million dropped considerably at banks in the survey and was the lowest since early 2019 (Chart 2, left panel). As a result, the volume of operating loans above the $1 million mark was cut by half from a year ago and volumes comprised of smaller sized notes also decreased by 15% (Chart 2, right panel).
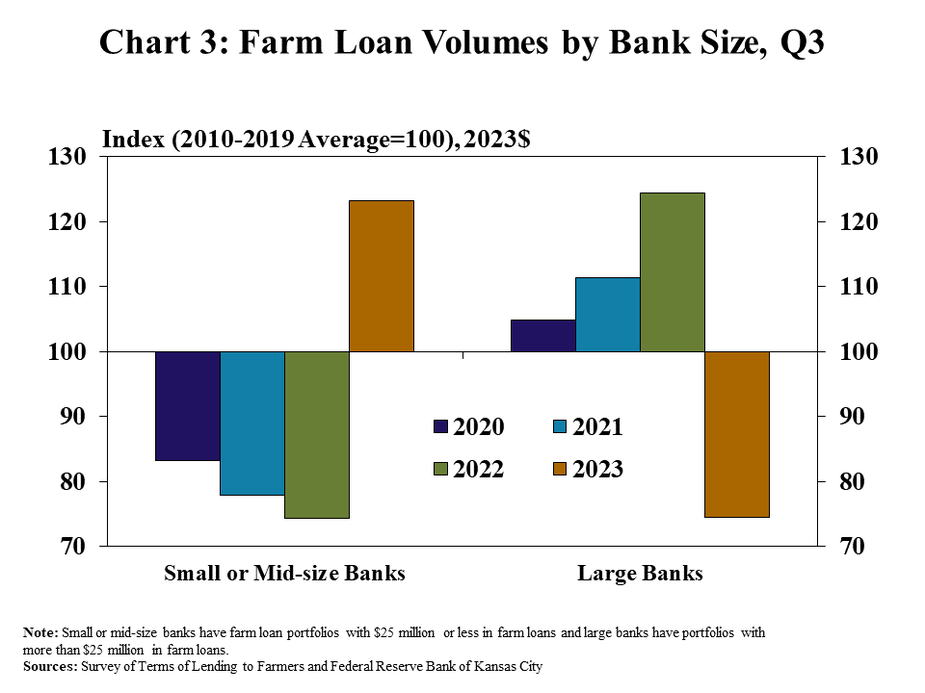
Lending slowed at larger lenders while increasing among smaller lenders. The volume of non-real estate lending at banks with farm loan portfolios below $25 million was nearly 25% above the recent average for the third quarter while volumes were 25% lower at large banks (Chart 3). The changes across bank size were in contrast to recent years and coincided with fewer large loans, which are more typical at bigger banks.
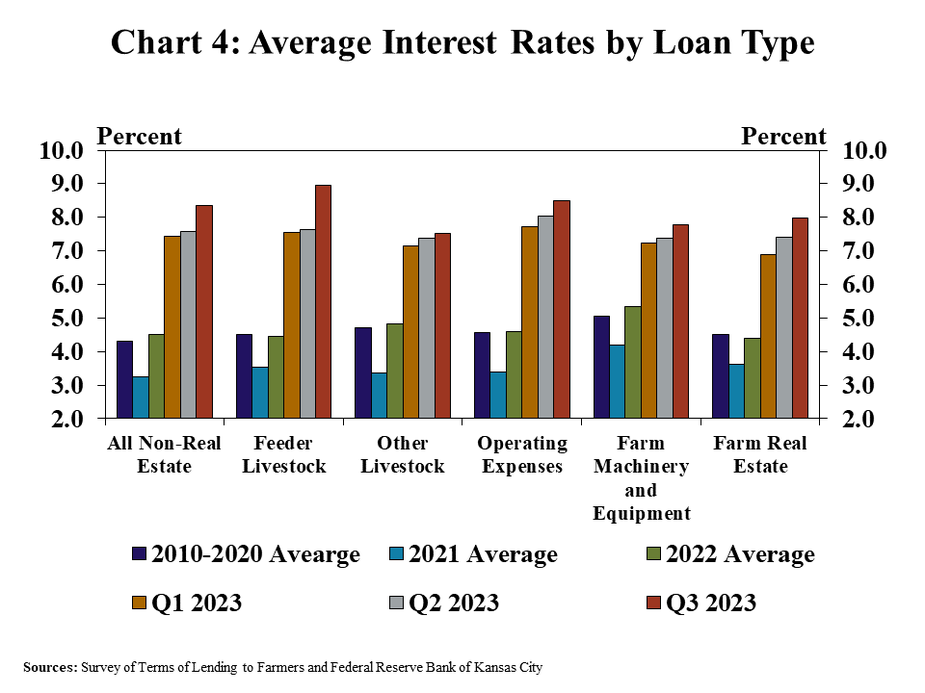
Lending has softened alongside sharp increases in interest rates. Average interest rates on all types of farm loans increased for the seventh consecutive quarter and reached the highest level since 2007 (Chart 4). The quick rise in rates has pushed up financing costs considerably and likely influenced producers’ decision making related to debt usage.
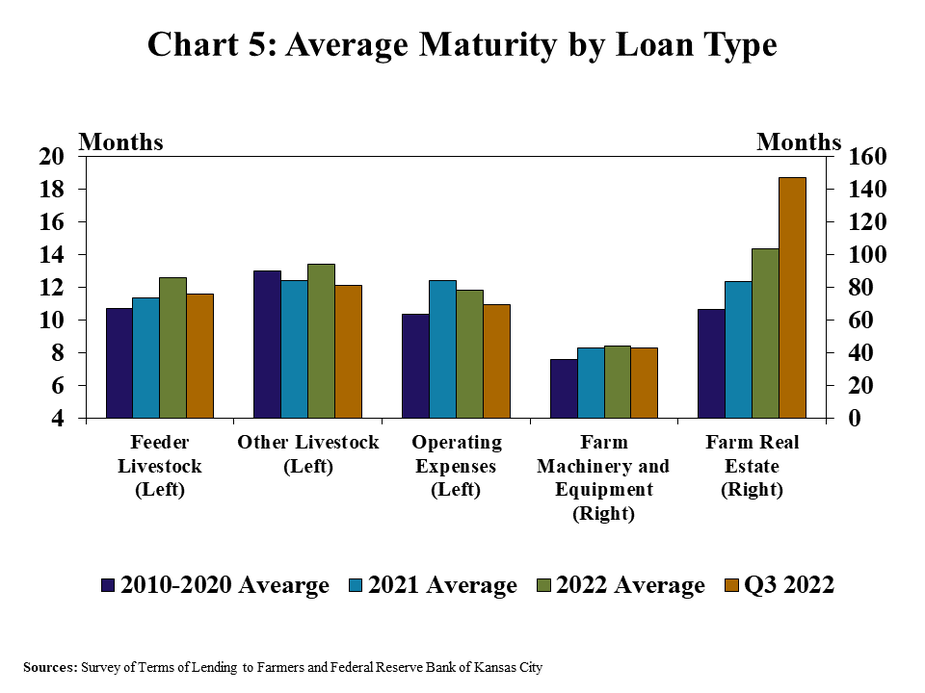
As rates have risen, the average maturity of longer-term loans has increased notably. The average maturity of loans for operating costs, livestock purchases, and equipment remained near the recent historic average (Chart 5). In contrast, the average duration of new farm real estate loans has increased gradually over the past year and was more than 5 years longer than the average from 2010 to 2020.