Individual states adopted various measures to limit the spread of COVID-19 across their communities throughout 2020. Many of these public health-related policies led to closures of certain types of economic activity, particularly those associated with close contact between workers and customers. Other economic activities deemed essential or critical have continued to operate with precautions to protect workers to the extent possible. In this edition of the Rocky Mountain Economist we map essential employment within the region and show how locations near essential activities fared with regard to employment outcomes and local consumption relative to those without critical industries nearby.
Workers employed in essential occupations and the facilities housing essential industries are not evenly spread across the Rocky Mountain region. As a result, some local economies suffered more acute challenges in sustaining economic activity at the onset of the pandemic. Those communities in closer proximity to essential activities were somewhat more insulated from the pervasive economic challenges. Counties with greater concentrations of essential industries tended to have smaller losses in total employment and disproportionately smaller declines in retail spending initially. Though the geographic disparities in consumption activity diminished after the initial onset of the pandemic, the recent rise in the number of cases and waning policy support may put renewed emphasis on policies that determine essential versus nonessential industries. Several states have re-adopted or strengthened limits on certain activities to combat the latest resurgence in the number of COVID-19 cases. Thus, proximity to essential work again may prove to be an important driver of local economic activity.
Mapping Essential Activities in the Region
The states within the Rocky Mountain region — Colorado, New Mexico and Wyoming — differ in the makeup of industries that shape their economies. Within each state, local economies also differ from county to county. As seen in Map 1, some counties have low concentrations of employment in industries that the respective state classified as essential or critical during the pandemic, as indicated by a lighter shade of blue. In Colorado, many of the counties with the lowest concentration of essential work are in the Front Range areas. For example, in Pueblo, Adams and Denver counties roughly half of local employment prior to the pandemic was in essential industries. In New Mexico only sparsely populated areas with low levels of overall employment have high concentrations of essential industries. Wyoming differs from its southern neighbors as essential work is spread more diffusely throughout the state, with relatively little variation between counties.
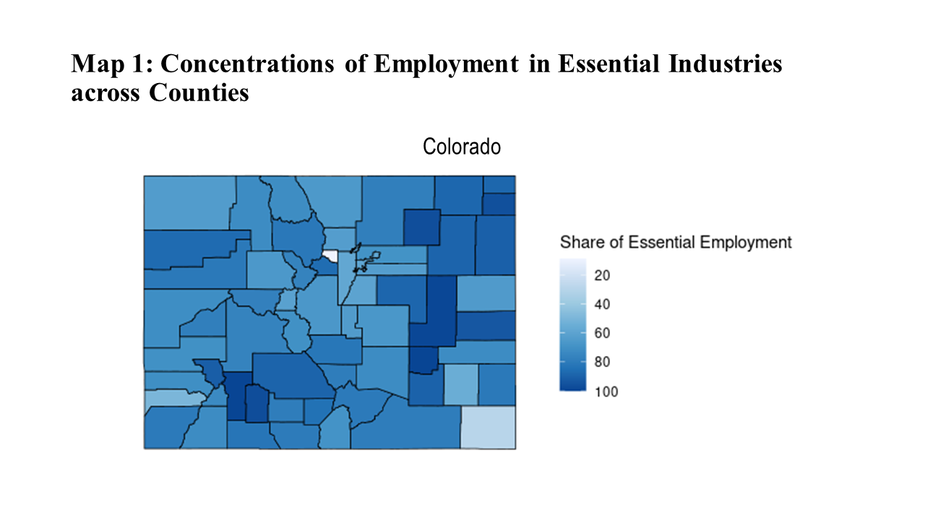
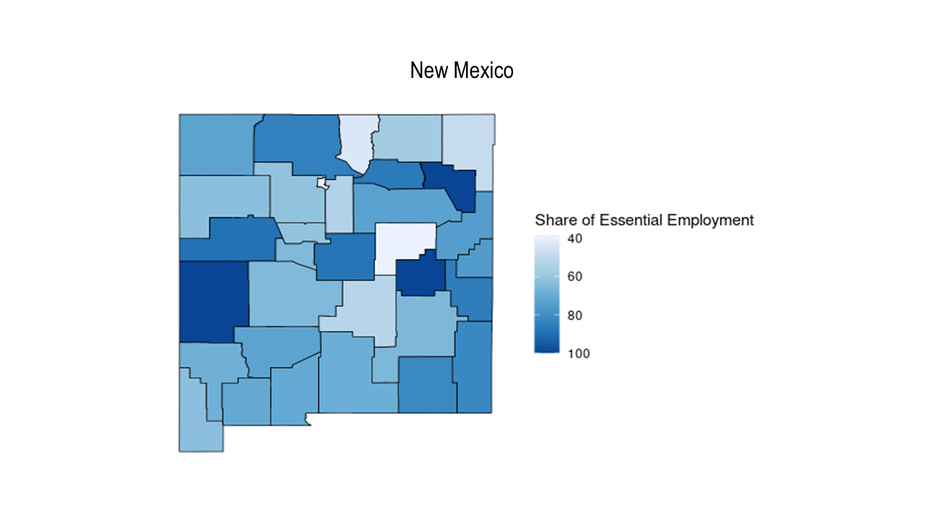
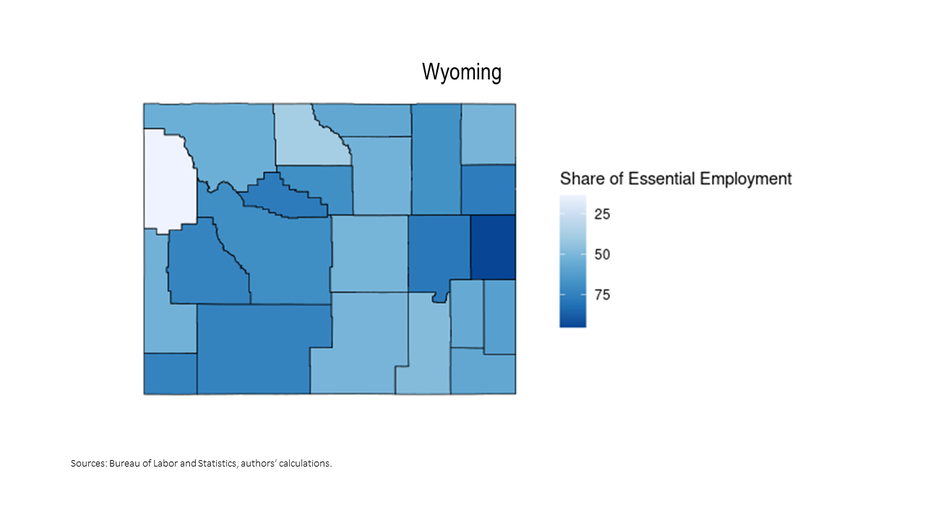
Even though Map 1 shows vast differences in the concentration of essential employment, the panels still likely underestimate the variation in how public health policies relate to economic activity between counties or across states. The data underlying the maps above are derived from the Bureau of Labor and Statistics’ Quarterly Census of Employment and Wages, which reports county-level employment for each industry. We then built a concordance between employment levels and each state’s individual declarations of which industries are deemed critical. The different choices about how states apply policies that limit economic activities, and the potential differences in other health policies that may affect the ability of workers and businesses to remain active (e.g., school closures), can generate even more differences in economic outcomes between local economies. Still, as we show, even this coarse mapping of essential activities can reveal much about local economic outcomes during the pandemic.
More Resilient Employment where Essential Work Is Prevalent
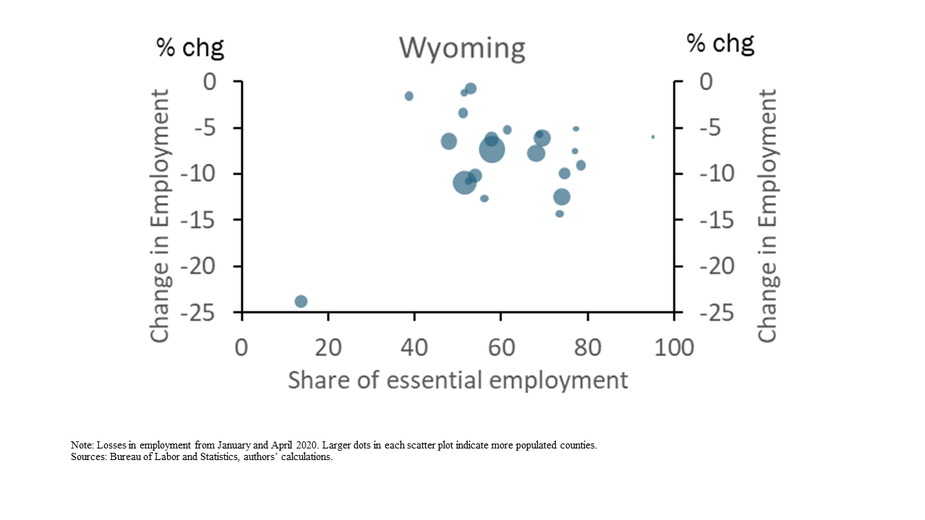
One of the prevailing narratives about the regional (and the national) economy is that the path of the outlook is tied to the path of the pandemic. In addition to the ebbs and flows of the number of COVID-19 cases across the region, the proximity to essential economic activities has been an important factor driving economic resiliency. Map 2 shows changes in overall county-level employment between January and April 2020 and shows that the pattern of job losses tends to mirror the locations of essential employment throughout the region. That is, the counties that tend to have the largest concentrations of essential work were those that experienced the smallest proportions of job loss at the onset of the pandemic.
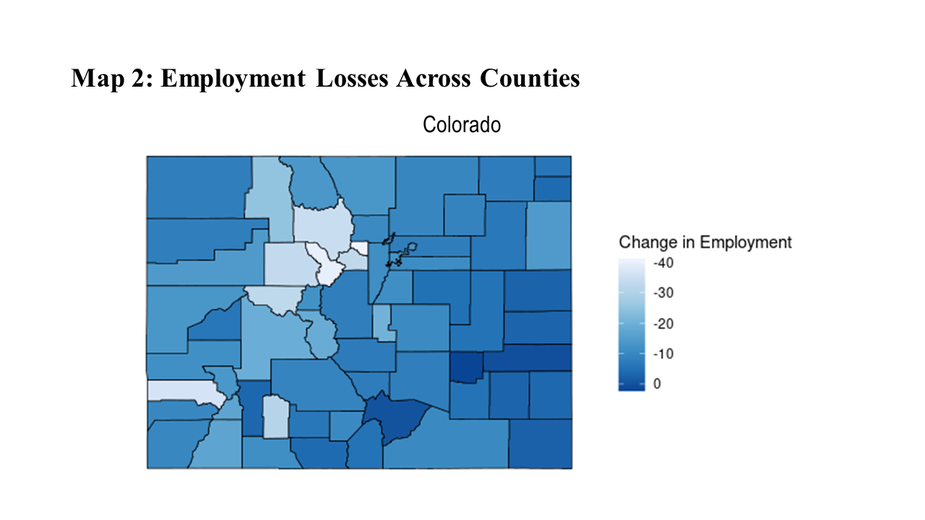
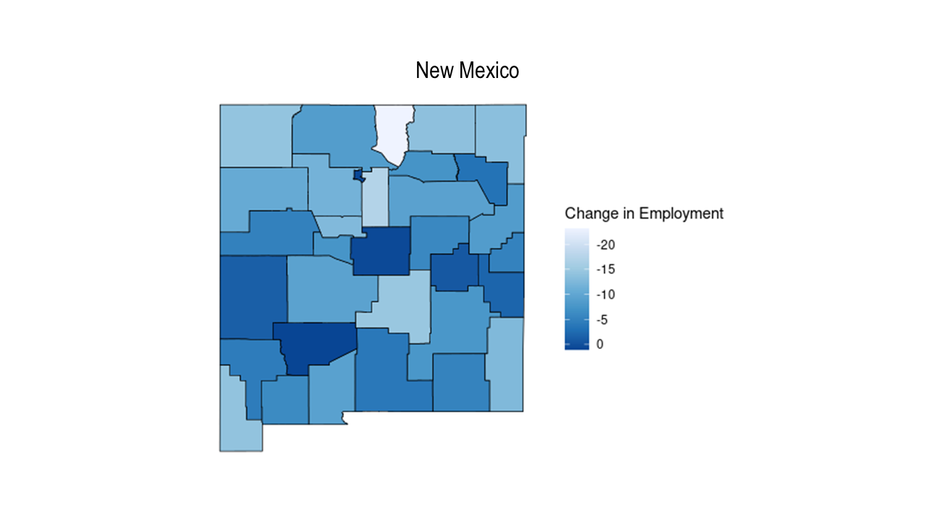
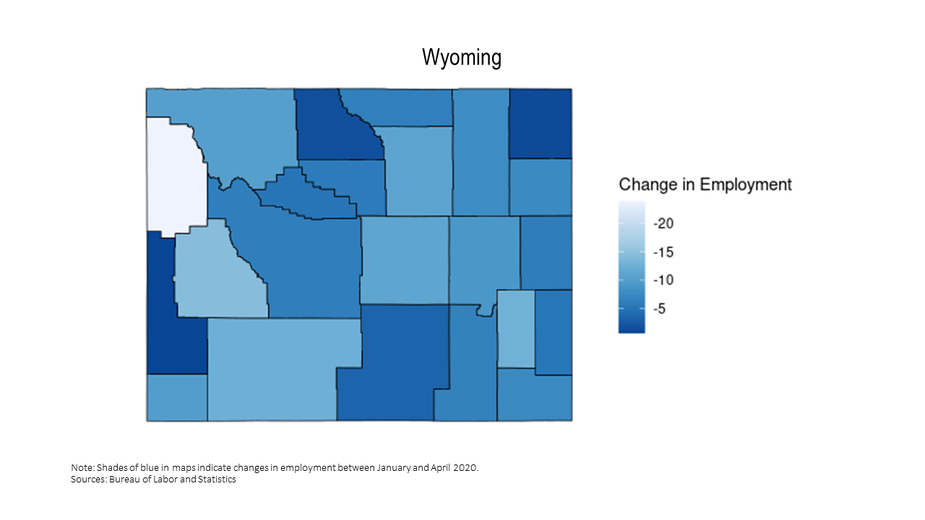
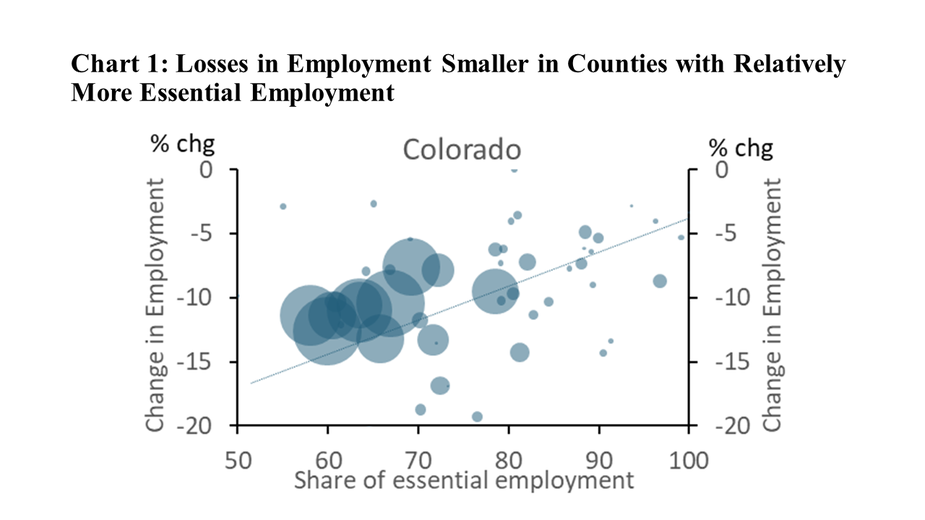
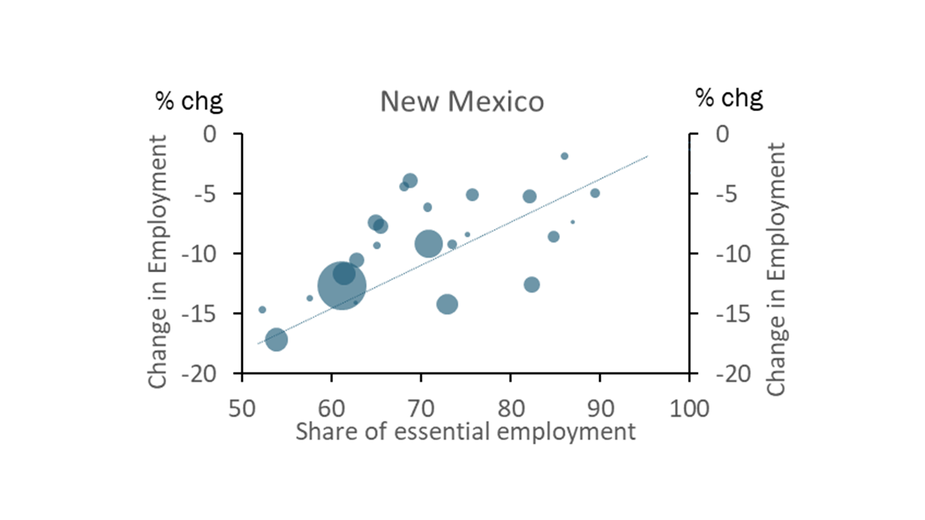
For each state in Map 2, a darker shade of blue corresponds to smaller losses in employment. To illustrate the similarities between the location of essential work (Map 1) and the resiliency of employment (Map 2) the scatter plots in Chart 1 contrast the two for each state. Individual dots represent a single county in the Rocky Mountain region, with bigger dots corresponding to counties with larger populations. The relationship in Colorado and New Mexico shows that proximity to essential work did buttress local economies to some extent. On average, having 10% more workers doing critical work meant that counties tended to face roughly 2.5% smaller reductions in employment. The potential differences in employment are substantial because counties in Colorado and New Mexico range between 50% and 90% concentrations in essential employment. In Wyoming, counties have little variation in their proximity to essential employment, and accordingly experienced relatively uniform and modest losses in employment at the onset of the pandemic. In short, polices that delineate essential employment are an important factor for the regional outlook.
Retail Spending Remained More Stable in Counties with More Essential Activity
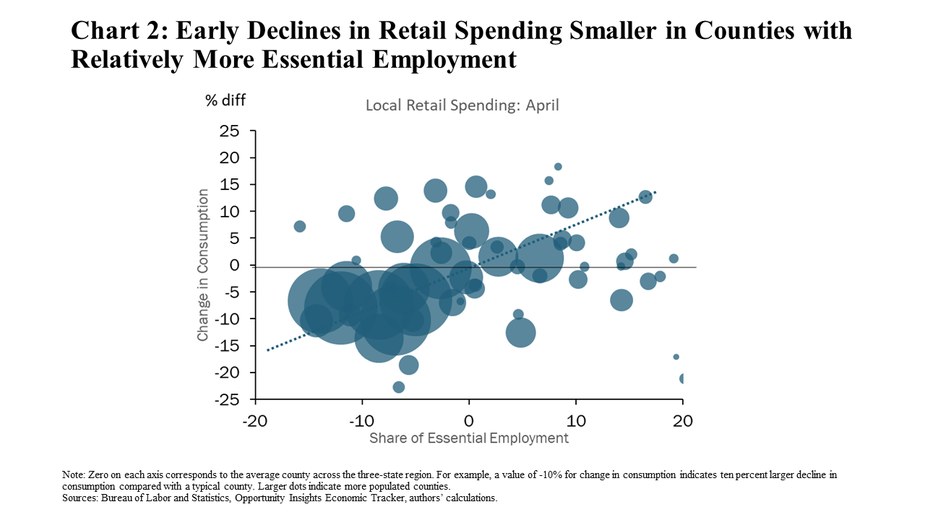
The connection between essential work and local employment is expected because the intent of public health policies specifying essential industries was to allow them to continue operating, albeit with as much safety precautions in place as possible. However, the direct effects of some activities being curtailed were compounded as they spilled over to other parts of the local economy. (Of course, such policies had implications for public health that affect the wellbeing of our communities. The goal here is to highlight some of the economic repercussions as the region works to inhibit the spread of COVID-19.) Consider a county with relatively more workers employed in grocery stores, skilled trades, car dealerships or other essential activities. Such a county likely experienced smaller declines in employment (recall Chart 1) or relatively less uncertainty about the local economic outlook. Accordingly, local restaurants and retail shops in these counties likely faced shallower dips in demand. Chart 2 shows that at the onset of the pandemic retail spending in counties with less employment in essential industries indeed suffered disproportionately greater losses in consumption than counties where critical industries are less prevalent. So, not only did counties with a larger base of activity in nonessential sectors face the challenge of supplying their customers amid public health restrictions, they also may have faced compounding headwinds from reduced local demand that further depressed retail spending.
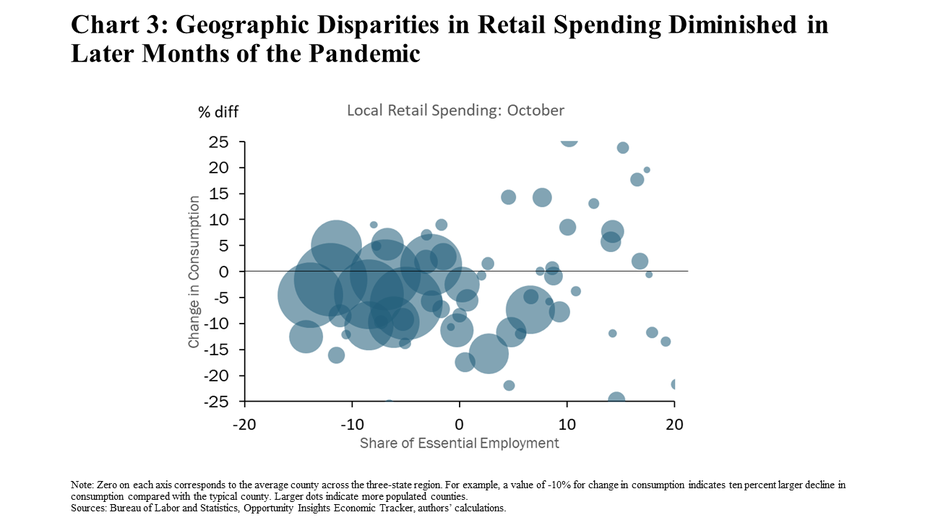
While public health policies seem closely linked with local retail spending activity early in the pandemic, after several months the disparities in consumption between counties diminished. Fast-forwarding from April to October, Chart 3 shows overall declines in spending were much more shallow than during the first phase of the pandemic. Also, the declines in spending generally were even across counties, regardless of the makeup of local employment.
Several factors likely supported counties with more nonessential employment in the later months of 2020. First, a variety of economic policies provided support. The Payment Protection Program allowed businesses, predominantly in service sectors, to retain workers. Unemployment benefits and economic stimulus payments from the CARES Act provided aid to households no matter their proximity to essential activity. Second, many service businesses that were not deemed essential evolved in their ability to serve customers remotely throughout the year. These adaptations facilitated retail activity where consumer demand remained. For example, the Kansas City Fed Services Survey from November indicates that a majority of businesses added or enhanced their online platforms to serve their customers during 2020. Finally, the most recent and most severe wave of COVID-19 had only begun to emerge in October, and so consumer attitudes may have been more open to being out and about in their communities.
All of these factors likely played some role in muting geographic disparities in spending this fall. Importantly, all of these factors are likely to remain dynamic going forward. The extent of fiscal support is somewhat uncertain. States continue to wrestle with the appropriate restrictions on nonessential activity. And, most prominently, the course of the pandemic is poised to change as the number of cases remains elevated even as vaccines are becoming available. Accordingly, the role of policies that classify essential industries is likely to remain dynamic going forward.
The views expressed are those of the authors and do not necessarily reflect the positions of the Federal Reserve Bank of Kansas City or the Federal Reserve System.
Authors

Nicholas Sly
Vice President, Economist, and Denver Branch Executive