A variety of broad economic indicators show Oklahoma’s economy struggled in 2016 after also experiencing difficulties for much of 2015. However, despite a sharp decline in state output and tax revenues since early 2015 and oil prices remaining much lower than a few years ago, conditions in the state’s labor and real estate markets have deteriorated only modestly. Looking ahead, firms’ expectations, as indicated in Federal Reserve regional business surveys, also suggest some cautious optimism for the state’s economy in 2017.
Economic activity remains lower than a year ago
A decline in economic activity is the basic definition of a recession, and current readings of all the main broad economic indicators of Oklahoma’s economy remain below year-ago levels. This includes real gross domestic product (GDP), real personal income, nonfarm payroll employment and state tax revenues. These indicators also fell in some or all quarters of 2015. However, the degree of decline in 2016 varied across indicators, with some dropping sharply and others experiencing only slight pullbacks.
Chart 1. Real GDP
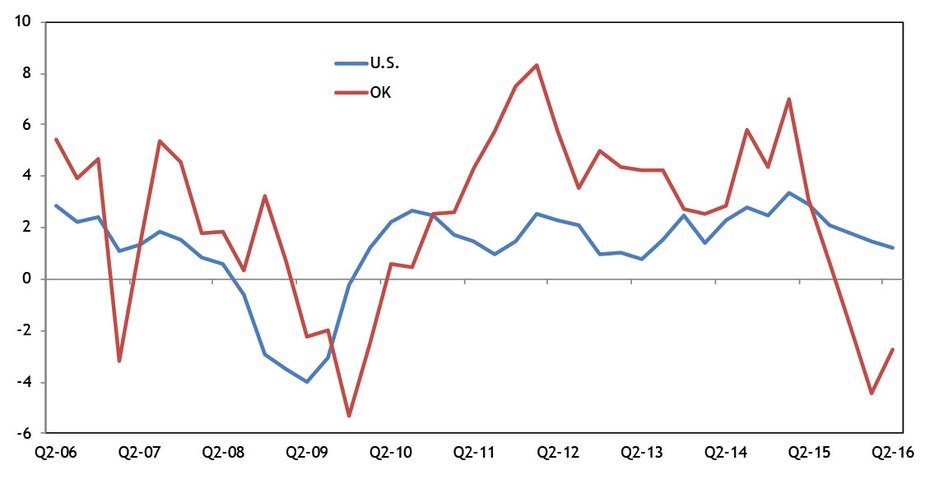
Source: BEA
Chart 2. State Tax Revenue
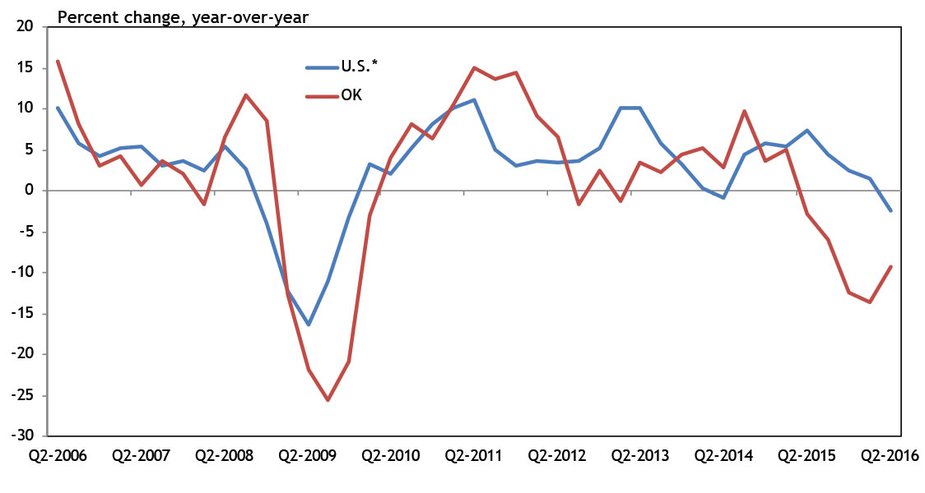
Source: Census
*U.S. is the sum of states
The largest declines in broad Oklahoma economic indicators have been for real GDP and state tax revenues. Real GDP in Oklahoma has been below year-ago levels since the fourth quarter of 2015 (Chart 1). Compared to its peak in the first quarter of 2015, real state GDP is now more than 5 percent lower. State tax revenues have been below previous-year levels for even longer than real GDP—since the second quarter of 2015 (Chart 2). At their worst points since this downturn began, however, the year-over-year declines in both real state GDP and state tax revenues have been less than during the Great Recession of 2007-09.
Chart 3. Nonfarm Payroll Employment
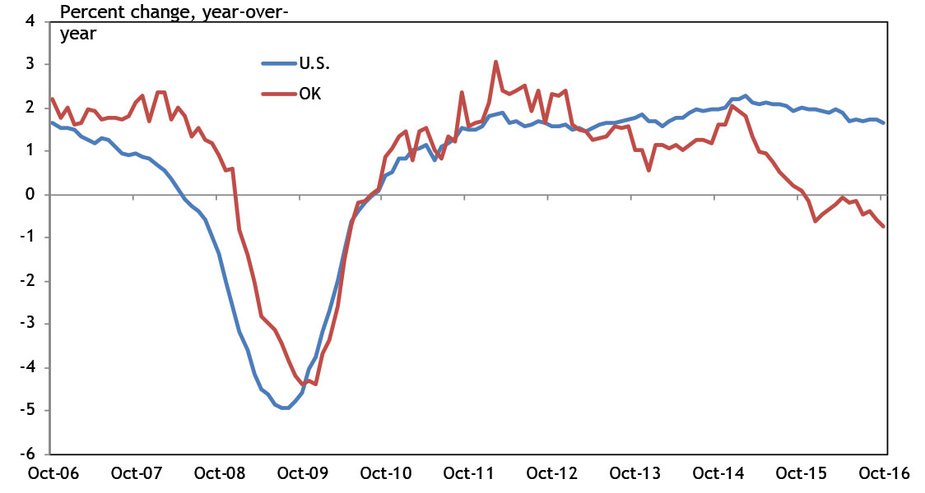
Source: BLS
Chart 4. Real Personal Income
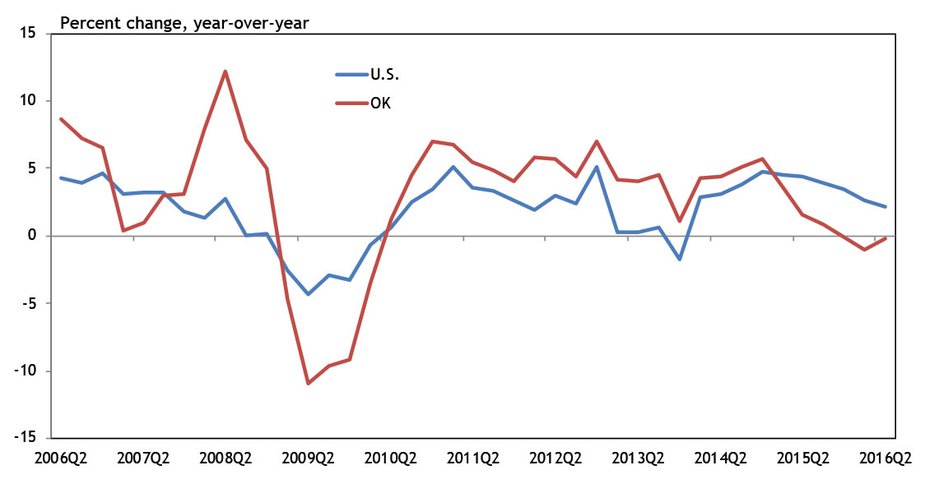
Source: BLS
Two other broad indicators of state economic activity—nonfarm payroll employment and real personal income—also have declined, but much less sharply (Charts 3 and 4). These two indicators largely reflect labor market conditions rather than changes in overall output or spending directly, which more closely affect real GDP and state tax revenues. Nonfarm payroll employment in Oklahoma has been below year-ago levels since November 2015, but never by more than 0.75 percent—less than a fifth of the decline in jobs in the state at the trough of the Great Recession. Similarly, real personal income in Oklahoma has been slightly below year-ago levels since the fourth quarter of 2015, but never by as much as 1 percent, compared with income declines of over 10 percent during the Great Recession.
Labor and real estate markets only modestly weaker
With nonfarm payroll employment declining slightly for most of the past year, the unemployment rate in Oklahoma has increased (Chart 5). By October 2016, the rate had risen to 5.2 percent, more than a full percentage point higher than its January 2016 reading. This put Oklahoma’s jobless rate slightly above the national rate. However, unemployment in the state remains considerably below its peak of 7.1 percent during the Great Recession, despite the economic difficulty of the past two years.
Chart 5. Unemployment Rate
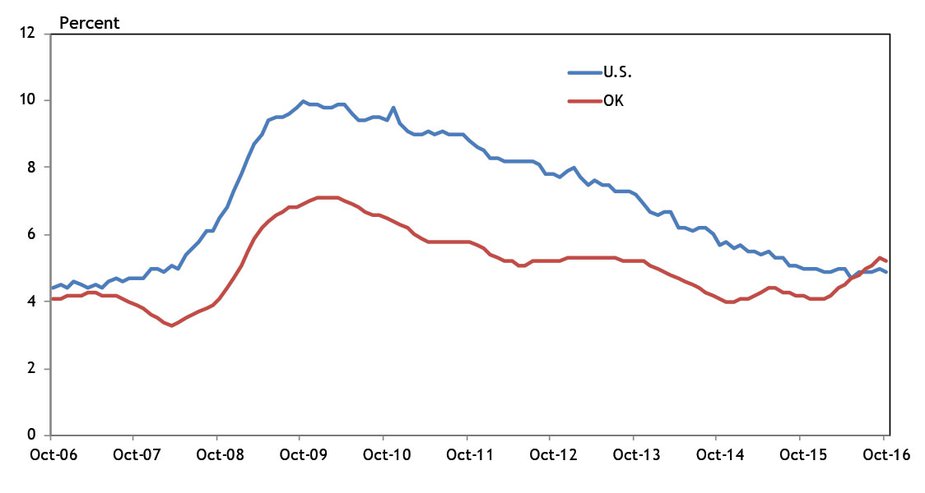
Source: BLS
Chart 6. Purchase-Only Home Price Index
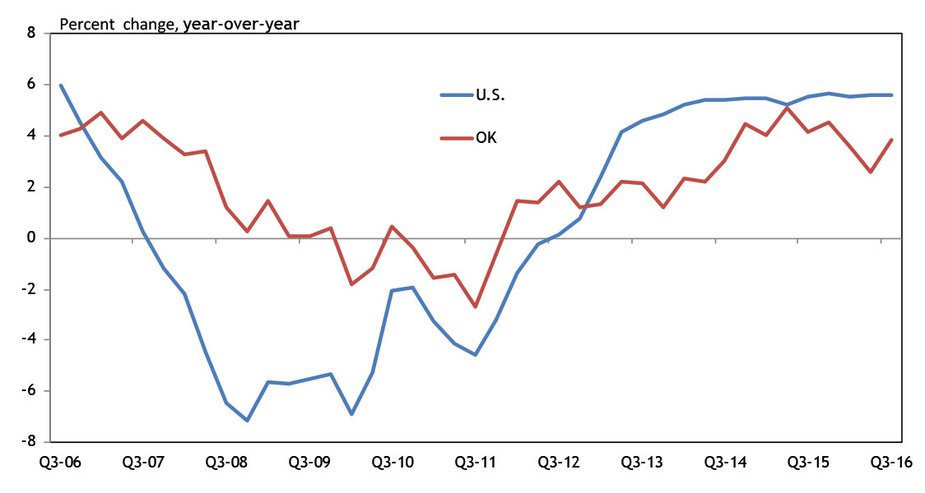
Source: FHFA
The state’s housing sector also has suffered from the decline in broader economic activity. New permits for single-family houses through the first three quarters of 2016 were down 5 percent from the same period in 2015. However, this slowdown in new home construction has likely helped keep home prices in the state from falling. Federal Housing Finance Agency (FHFA) data show quality-adjusted home prices in Oklahoma in the third quarter of 2016 were 3.9 percent higher than a year ago (Chart 6). This pace of growth in home prices was slower than what prevailed in the state for much of 2015 and in the nation overall in recent years. However, it was significantly better than the modest declines in home prices the state experienced following the Great Recession.
Chart 7. Metro Office Vacancy Rates
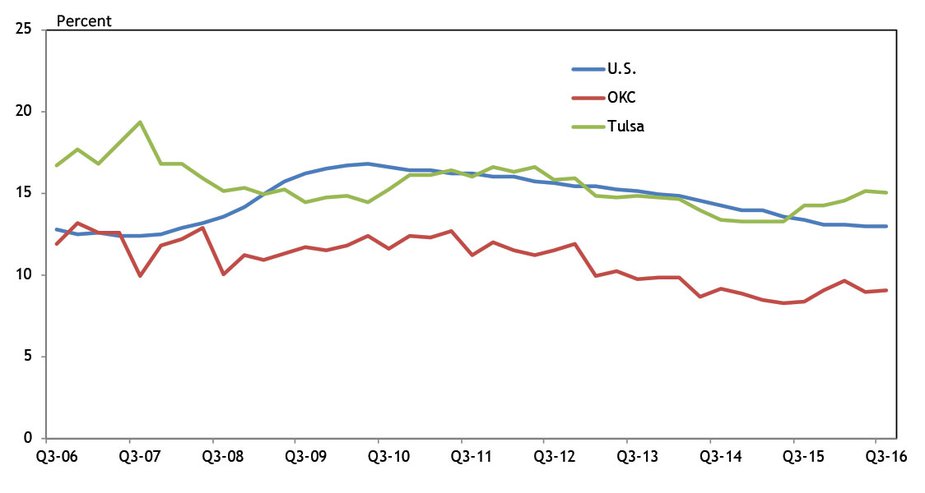
Source: CBRE
Similarly, office market conditions in the Oklahoma City and Tulsa metropolitan areas have deteriorated somewhat as the state’s economy and the important energy sector have shed jobs. Office vacancies in the Oklahoma City metro rose from 8.3 percent in the third quarter of 2015 to 9.0 percent in the third quarter of 2016; vacancies in the Tulsa metro rose from 14.2 percent to 15.0 percent in the same time (Chart 7). Vacancies in these two areas increased even as the national rate continued to edge lower over the past year. However, office vacancy rates remain below their 2010 peaks in both of Oklahoma’s large metros, while the Oklahoma City metro also is well below the national rate.
Firms cautiously optimistic about 2017
Looking to 2017, one source of information about the potential direction of Oklahoma’s economy is business surveys conducted by the Federal Reserve Bank of Kansas City. In particular, the Bank’s monthly manufacturing survey and quarterly energy survey each ask firms about their expectations for overall activity and employment six months ahead. While these surveys cover firms throughout the Kansas City Fed’s seven-state region, a majority of firms in the energy survey is from Oklahoma, and many firms in the manufacturing sector produce materials and equipment for the energy sector.
Chart 8. Tenth District Manufacturing Expectations
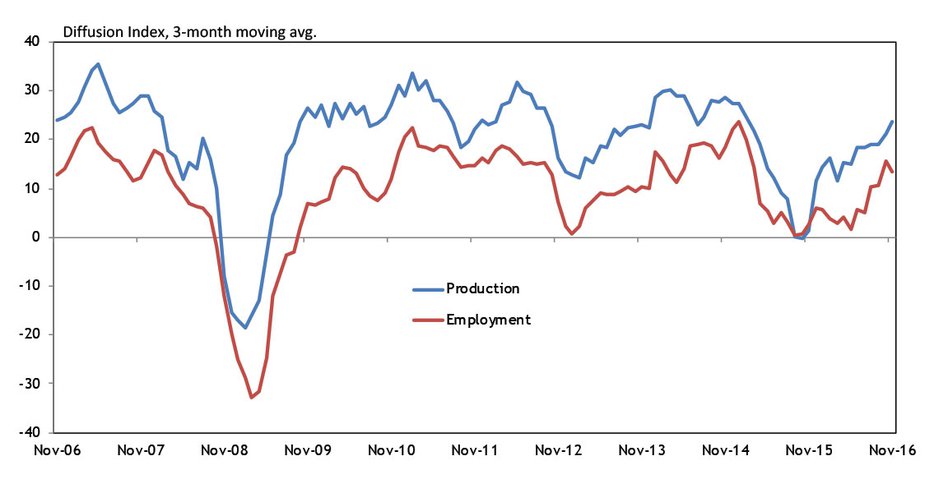
Source: FRBKC Manufacturing Survey
Manufacturing activity in the Federal Reserve’s Tenth District has declined for much of the past two years, driven both by a sharp decline in commodity prices that has hurt energy-related manufacturers and by a stronger dollar, which has hurt overall exports from the region. However, for the past three months, overall factory activity in the Tenth District has increased again, driven in part by stronger activity in the metals and machinery segments that produce equipment for the energy sector and others. In addition, expectations for future factory activity have increased considerably since the spring (Chart 8). Factories, though, have indicated they expect production to expand faster than employment, which could help boost indicators like real GDP and state tax revenues more than employment or personal incomes.
Chart 9. Kansas City Federal Reserve Energy Survey Special Questions
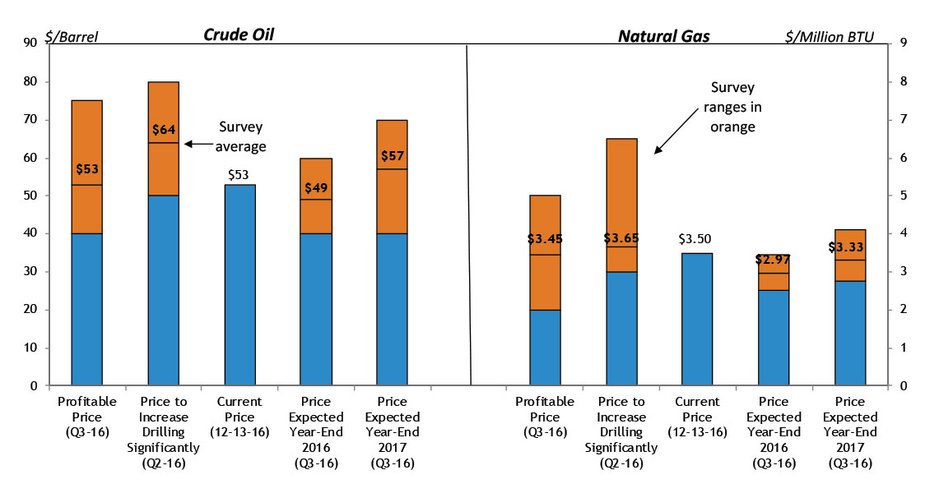
Source: FRBKC Energy Survey
Chart 10. Tenth District Energy Survey Indexes
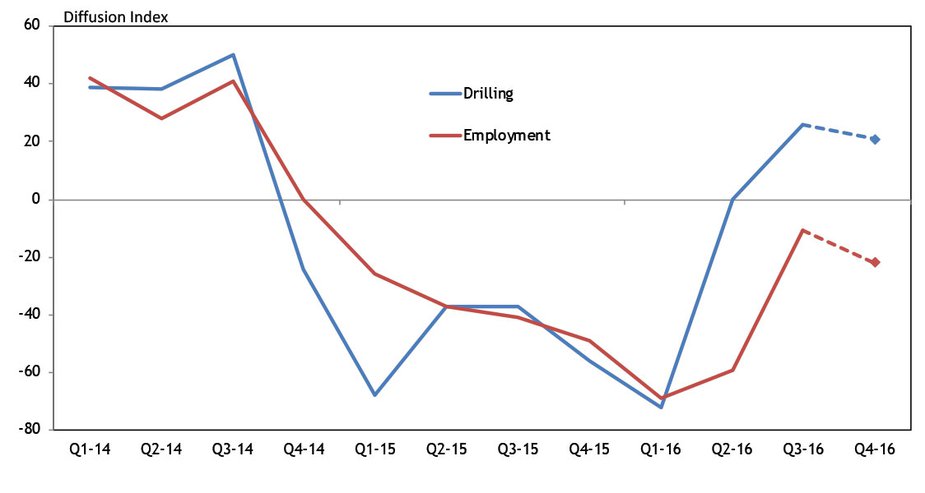
Source: FRBKC Energy Survey
Energy activity in the region also began to increase in the second half of 2016 amid higher oil prices. The count of active oil and gas rigs in Oklahoma has increased more than 40 percent since June, though it remains more than 60 percent below its 2014 peak. In special questions in the Kansas City Fed’s quarterly energy survey about the prices firms need to be profitable, recent oil and gas prices have been around these levels, helping explain the recent pickup in activity (Chart 9). However, increases in drilling are likely to remain relatively moderate unless oil prices continue to increase. Firms on average reported they need oil prices to be $64 a barrel for them to “significantly increase drilling,” and a majority of firms did not expect oil prices to reach those levels until at least 2018. Moreover, while the drilling index in the Kansas City Fed’s energy survey also moved into expansionary territory in the third quarter, the employment index continued to fall, trends that firms generally expect to continue over the next six months (Chart 10). As such, the recent moderate increase in drilling activity could boost indicators such as real GDP and state tax revenues that have fallen most, but may not have much positive impact on state employment growth.
Summary
Economic activity in Oklahoma has declined over the past year, more so among indicators reflecting changes in output, such as real GDP, than among indicators reflecting labor market conditions. As such, while unemployment in the state has increased, it remains relatively low compared with rates that prevailed following the Great Recession of 2007-09. Likewise, real estate conditions in the state, in terms of home prices and office vacancy rates, have also held up relatively well. Finally, firms responding to the Kansas City Fed’s manufacturing and energy surveys report some increased optimism about their output over the next six months, although their expectations for employment growth are not as strong.
The views expressed are those of the authors and do not necessarily reflect the positions of the Federal Reserve Bank of Kansas City or the Federal Reserve System.
Author