The previous edition of the Oklahoma Economist showed Oklahoma’s labor force participation rate recently surpassed the national rate for the first time in decades, driven especially by greater workforce participation among Native Americans. This edition analyzes in more detail the economic progress made by Native Americans across the state over the past 10 to 15 years. As incomes and education levels have risen in tribal areas—where most of the state’s Native American population lives—poverty rates among Native Americans have come down more than the national average in most of these areas.
Oklahoma’s unique tribal statistical areas
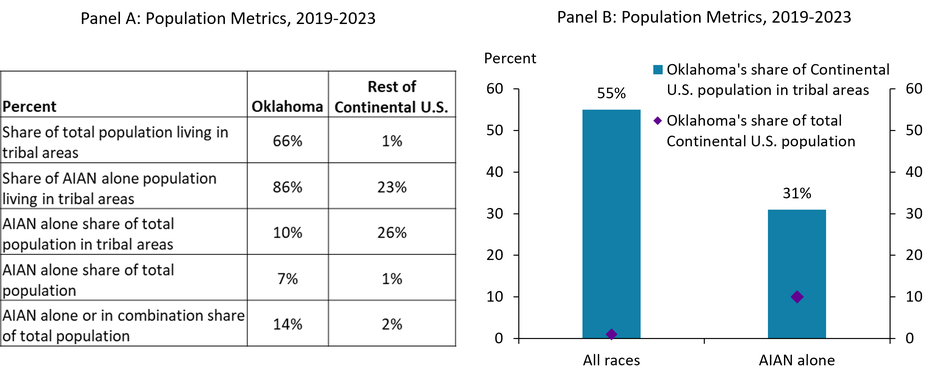
Oklahoma’s Native American population as a share of total population is about seven times larger than in the nation as a whole, whether measured as American Indian and Alaska Native (AIAN) alone, or AIAN in combination with other races (Chart 1, Panel A). The vast majority of Oklahoma’s Native American population lives in one of the state’s 26 Oklahoma Tribal Statistical Areas (OTSAs). These areas include most of the state’s land mass and two-thirds of the overall population, with the only exceptions being in the northwestern and very central parts of the state (Map 1).
Chart 1: Two-thirds of Oklahoma’s population lives in a tribal area, and the state makes up an outsized share of the U.S. population in tribal areas
Note: AIAN abbreviates American Indian/Alaska Native alone.
Source: American Community Survey 5-year estimates, authors’ calculations
Map 1: Oklahoma Tribal Areas
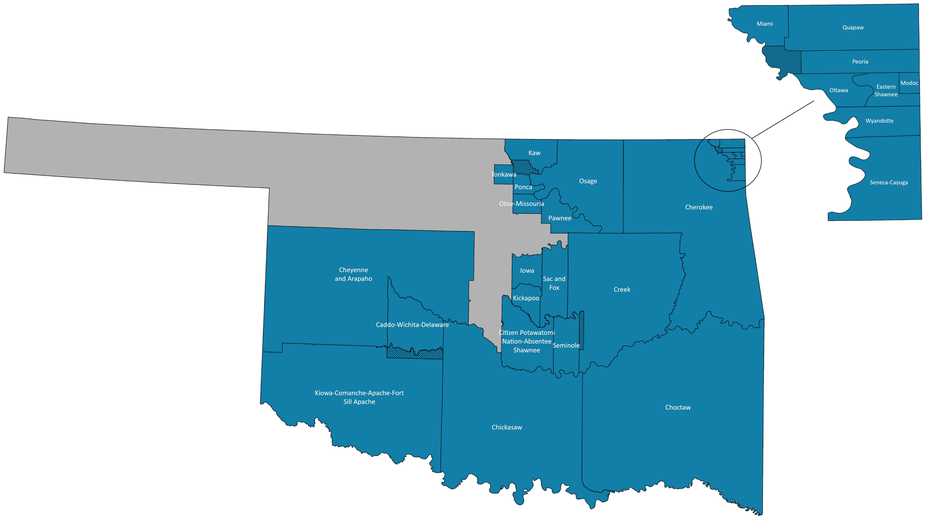
Note: Hatched areas show Oklahoma’s joint-use OTSAs: Creek/Seminole, Kaw/Ponca, Kiowa-Comanche-Apache-Fort Sill Apache/Caddo-Wichita-Delaware, and Miami/Peoria.
Source: Census Bureau
Elsewhere in the continental United States, less than a quarter of the Native American population and less than 1% of the total population lives in a tribal area (Map 2). No other state in the Lower 48 has as high of a share of its land mass in a tribal area as Oklahoma. Further, nearly a third of the nation’s AIAN alone population lives in an Oklahoma tribal area (Chart 1, Panel B). Thus, analyzing economic trends across and within these unique areas of Oklahoma is important for understanding how much and what kinds of economic progress has occurred for the state’s Native Americans.
Map 2: U.S. Tribal Areas
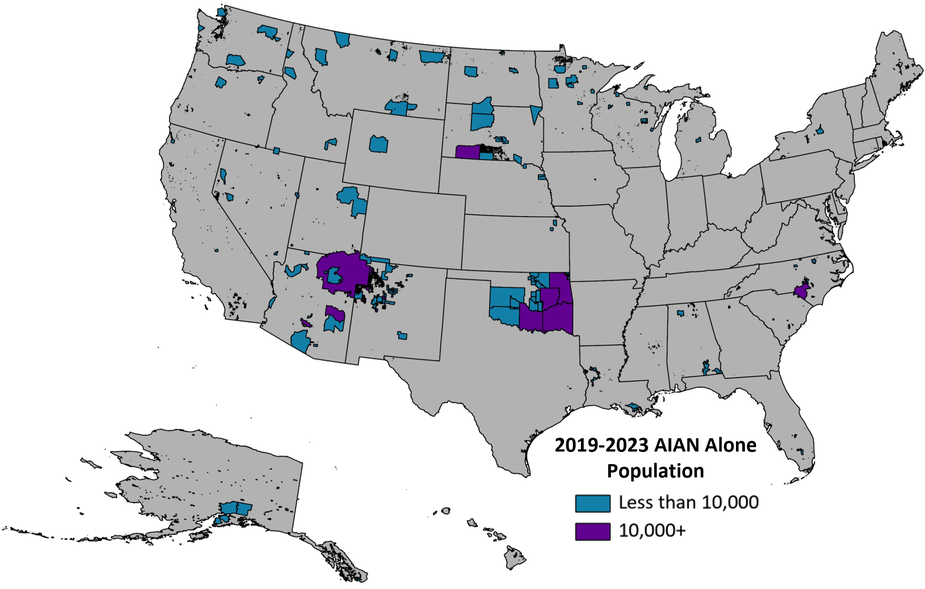
Note: AIAN abbreviates American Indian/Alaska Native.
Sources: Census Bureau, American Community Survey 5-year estimates
While Oklahoma accounts for much of the nation’s tribal area population, the state’s tribal areas differ somewhat from others in the United States. Almost all of Oklahoma’s tribal areas are specially defined as “statistical entities identified and delineated by the Census Bureau in consultation with federally recognized American Indian tribes that had a former reservation in Oklahoma,”_ whereas most tribal areas in other states are federally recognized reservations. Additionally, tribal areas outside of Oklahoma have higher concentrations of Native Americans, with AIAN alone making up about a quarter of their tribal area populations compared to a tenth, on average, in Oklahoma (Chart 1, Panel A). However, the state’s tribal areas also differ from one another, with populations ranging from around 200 to 800,000 people and with Native Americans (alone or in combination) making up as little as 9% of the population to as much as 50% (Table 1).
Table 1: Oklahoma’s tribal statistical areas vary widely in population and Native American concentration

Note: AIAN abbreviates American Indian/Alaska Native.
Source: American Community Survey 5-year estimates, authors’ calculations
Rising incomes and education
Oklahoma’s Native American population in tribal areas has seen impressive gains in incomes and educational attainment in recent decades. The Census Bureau’s American Community Survey publishes 5-year estimates of many economic and demographic indicators for U.S. tribal areas._ Recently released estimates for the 2019-2023 period show tribal areas’ improvement in several indicators relative to the 2006-2010 period.
Native American incomes in Oklahoma’s tribal areas have grown more than the national and state average, partially due to an acceleration in recent years. By 2018, AIAN incomes in tribal areas and incomes for all races in Oklahoma both grew around 20% from 2010 levels (Chart 2, Panel A). By 2023, AIAN tribal area incomes had grown 56% from 2010 levels while the state total increased 48%. Despite the higher gains, the median Native American in Oklahoma’s tribal areas still lagged the statewide median income by more than $7,500 in the 2019-2023 period (Chart 2, Panel B). AIAN incomes in U.S. tribal areas trailed the national average by a considerably larger amount, with the median Native American in U.S. tribal areas earning $46,408 in the 2019-2023 period compared to $78,538 in the U.S. as a whole.
Chart 2: Native American incomes in Oklahoma’s tribal areas have grown more than the national average, but are still below the state total
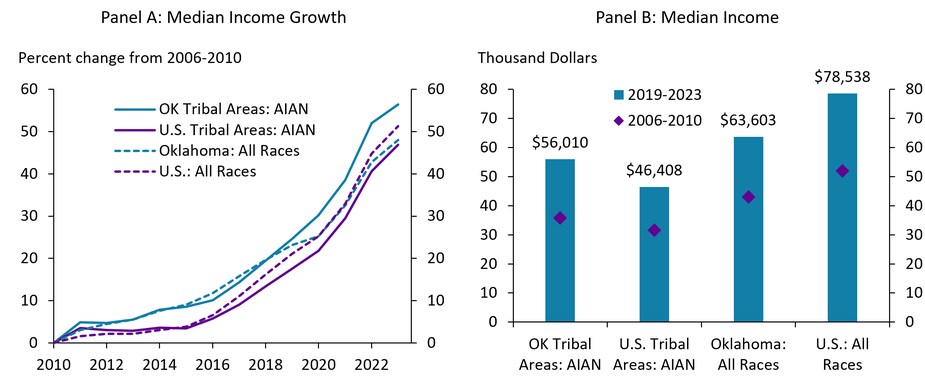
Note: Aggregated AIAN median incomes for tribal areas are calculated as the average of each area’s median income weighted by its AIAN population. AIAN abbreviates American Indian/Alaska Native alone.
Source: American Community Survey 5-year estimates, authors’ calculations
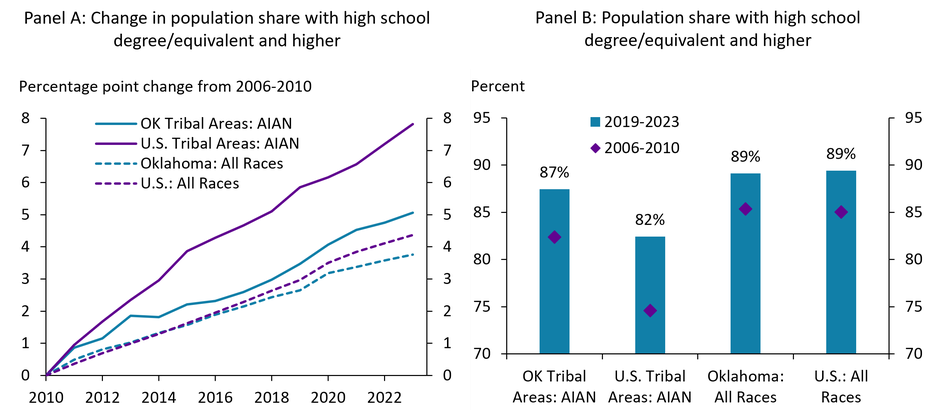
Many more Native Americans in tribal areas completed their high school education in the past decade than before. In Oklahoma’s tribal areas, the AIAN population has increased their high school completion rate by 5 percentage points to 87%, now only 2% below the state and national average (Chart 3, Panel B). The share of Native Americans in U.S. tribal areas with a high school degree or equivalent has risen by nearly 8 percentage points since 2010 (Chart 3, Panel A). Despite the impressive gains in educational attainment, the U.S. average rate for Native Americans in tribal areas is 82%, below the U.S. average of 89%.
Chart 3: The Native American population in tribal areas has seen impressive gains in high school graduation rates
Notes: Shares shown are for the population aged 25 and up. AIAN abbreviates American Indian/Alaska Native alone.
Source: American Community Survey 5-year estimates, authors’ calculations
Big improvement in poverty, especially in some tribal areas
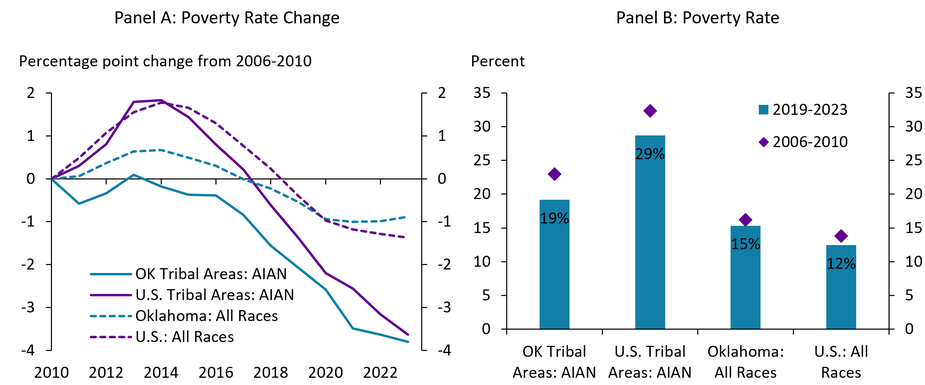
Rising incomes and education levels among Native Americans likely led to falling poverty rates in U.S. tribal areas. The poverty rates for Native Americans in tribal areas in both the U.S. and Oklahoma have steadily fallen since the 2010-2014 period. Their rates are now 3.5 to 4 percentage points lower than the 2006-2010 period, while the state and national averages for all races are only around 1 to 1.5 percentage points lower (Chart 4, Panel A). Despite this, a higher share of Oklahomans and Native Americans experience poverty than other populations in the United States. Oklahoma’s poverty rate is 15%, 3 percentage points higher than the national average, and its AIAN poverty rate in tribal areas is 19% (Chart 4, Panel B). While higher than the state average, Oklahoma’s Native American tribal area poverty rate is 10 percentage points lower than the rate for Native Americans in all U.S. tribal areas.
Chart 4: Oklahoma’s Native Americans in tribal areas have seen the largest reductions in poverty, with a poverty rate of 19%
Note: AIAN abbreviates American Indian/Alaska Native alone.
Source: American Community Survey 5-year estimates, authors’ calculations
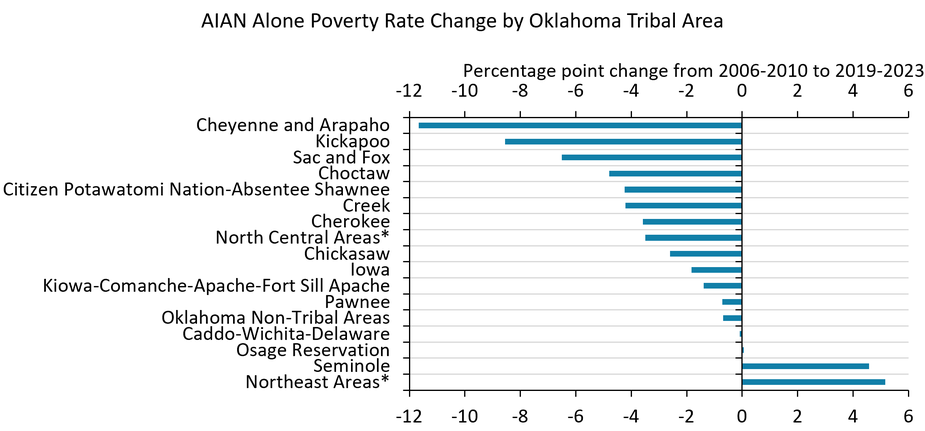
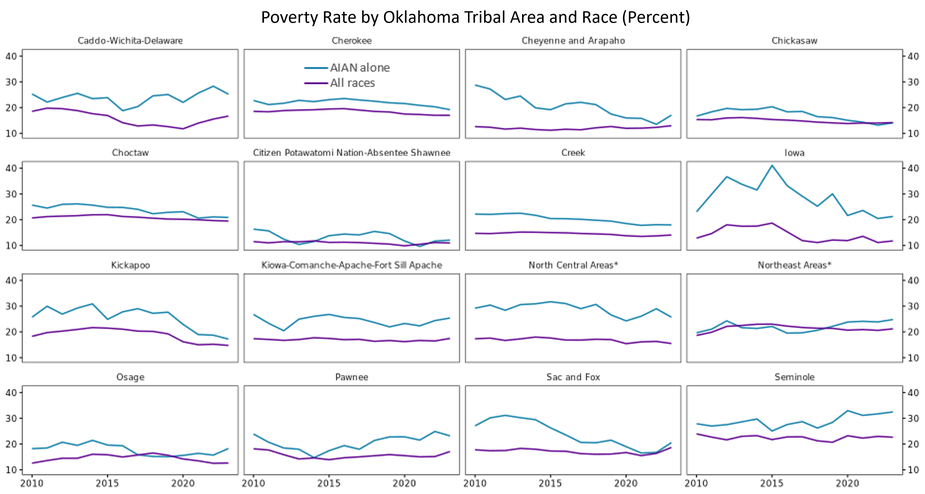
These improvements in poverty for Native Americans are broad-based across the state’s tribal areas. Almost all the tribal areas in Oklahoma saw meaningful reductions in their AIAN poverty rate since the 2006-2010 period (Chart 5). The Cheyenne and Arapaho, Kickapoo, and Sac and Fox tribal areas saw the greatest reductions in poverty rate, decreasing by 11.7, 8.6, and 6.5 percentage points, respectively. The poverty rate for Native Americans living in non-tribal areas in Oklahoma ticked down by about 0.7 percentage points and is not far from the tribal area average of 19%. The Native American poverty rates in Oklahoma’s tribal areas ranged from 12% to 32% in the 2019-2023 period, while the rates for all races ranged from 11% to 23% (Chart 6). The gaps between poverty rates for Native Americans versus all races has narrowed—and even closed completely—in many of the state’s tribal areas, including in the Chickasaw, Citizen Potawatomi Nation-Absentee Shawnee, Choctaw, Sac and Fox, Cherokee, Kickapoo, Creek, and Cheyenne and Arapaho OTSAs.
Chart 5: Poverty rates among Native Americans have fallen in almost all of Oklahoma’s tribal areas
*Notes: The North Central Areas aggregate the Kaw, Kaw/Ponca joint-use, Otoe-Missouria, Ponca, and Tonkawa OTSAs. The Northeast Areas aggregate the Eastern Shawnee, Miami, Miami/Peoria joint-use, Modoc, Ottawa, Peoria, Quapaw, Seneca-Cayuga, and Wyandotte OTSAs. AIAN abbreviates American Indian/Alaska Native.
Source: American Community Survey 5-year estimates, authors’ calculations
Chart 6: Poverty levels vary across Oklahoma’s tribal areas, but Native American rates have fallen to meet the total rate in some areas
*Notes: The North Central Areas aggregate the Kaw, Kaw/Ponca joint-use, Otoe-Missouria, Ponca, and Tonkawa OTSAs. The Northeast Areas aggregate the Eastern Shawnee, Miami, Miami/Peoria joint-use, Modoc, Ottawa, Peoria, Quapaw, Seneca-Cayuga, and Wyandotte OTSAs. AIAN abbreviates American Indian/Alaska Native.
Source: American Community Survey 5-year estimates, authors’ calculations
Summary and Conclusions
Oklahoma’s tribal areas make up most of the state’s land mass and over 85% of its Native American population. These areas have generally seen sizable economic improvement in recent decades. Incomes and high school completion rates have increased at above average pace for the Native American population in Oklahoma’s tribal areas and poverty rates have decreased considerably. Poverty among Native Americans remains higher than average in most Oklahoma tribal areas, but the progress made in recent decades may provide some optimism for continued improvement in decades to come.
The authors thank the Center for Indian Country Development (CICD) at the Federal Reserve Bank of Minneapolis for providing data resources. They also thank the Center for Advancement of Data and Research in Economics (CADRE) at the Federal Reserve Bank of Kansas City for providing essential computational resources. The views expressed are those of the authors and do not necessarily reflect the positions of the Federal Reserve Bank of Kansas City or the Federal Reserve System.
