Oklahoma’s labor force participation recently moved higher than the U.S. rate for the first time in over three decades. Most of the labor force gains were in or near the Oklahoma City and Tulsa metropolitan areas, but the southeastern portion of the state also made a sizable contribution. This edition of Oklahoma Economist finds that the state’s increase in labor force participation since 2021 has been primarily driven by heightened participation among the Native American population, in both metro and non-metro areas. Additionally, these gains have mostly been concentrated at schools, hospitals, and government entities.
Oklahoma’s labor force participation is now higher than the U.S.
Many observers track the nation’s unemployment rate to gain insight into supply and demand dynamics of the labor market, but another important indicator is the labor force participation rate. This rate measures the percent of the civilian working-age population (age 16+) that either is employed or actively looking for a job in the past four weeks (i.e., is unemployed). Labor force participation has trended down for much of the past 20 years as the nation’s population has aged and retirees make up more of the population, but Oklahoma’s rate has risen at an above-average pace in recent years.
In recent decades, Oklahoma’s labor force participation rate has typically been around 2-3 percentage points lower than the national average, with the gap narrowing slightly during recessions (Chart 1). When the U.S. rate dropped precipitously in April 2020—by three percentage points—Oklahoma’s rate fell less. Since the brief pandemic recession, Oklahoma’s labor force participation rate has risen more than the U.S. rate and, by April 2023, the state’s rate surpassed the U.S. average for the first time in over three decades. As of August 2024, Oklahoma’s participation rate sat at 63.1% while the nation’s was 62.7%.
Chart 1: Oklahoma’s labor force participation rate has been higher than the U.S. since April 2023.
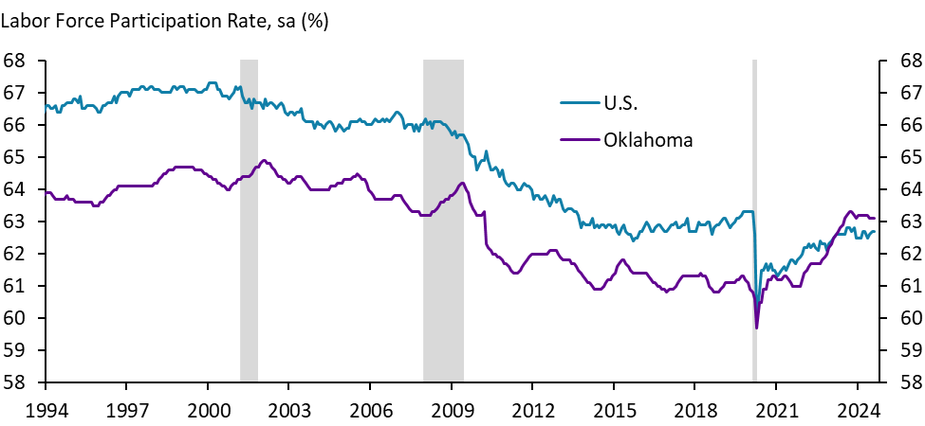
Note: Grey shading denotes NBER-defined recessions
Sources: BLS CES, BLS LAUS, NBER/Haver Analytics
There are two ways the labor force participation rate can rise: due to an increase in the labor force—the numerator—or due to a decrease in the civilian working-age population—the denominator. Oklahoma’s recent labor force participation rate growth has been driven by rapid gains in the state’s labor force. Since 2021, Oklahoma’s labor force has grown at a faster rate than both its population and the U.S. labor force (Chart 2). The state’s labor force growth peaked in 2023 at 3% while the civilian working-age population only grew 1%.
Chart 2: Oklahoma’s labor force has grown at a faster pace than the U.S. in 2023 and 2024.
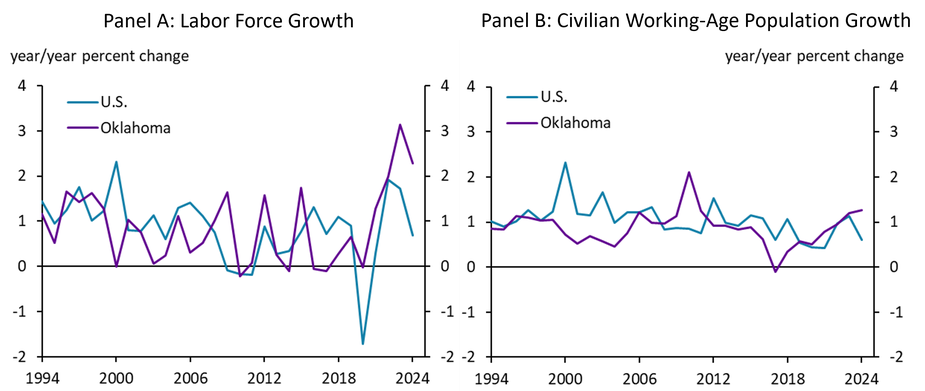
Note: 2024 growth is calculated as change in H1 (January to June) average from 2023 to 2024.
Sources: BLS CES, BLS LAUS/Haver Analytics
Most areas in Oklahoma increased their labor forces in the past four years, but the Oklahoma City and Tulsa Metropolitan Statistical Areas (MSAs) and the southeastern quadrant of the state have seen the most gains (Map 1). The Oklahoma City MSA netted around 63,000 new labor force participants since 2021, accounting for half of the state’s gains in that time. The Tulsa MSA contributed to a quarter of Oklahoma’s gains, adding around 33,000 people on net. Of the remaining labor force additions, nearly half were concentrated in the southeastern quadrant of the state.
Map 1: Oklahoma City, Tulsa, and southeastern Oklahoma have added the most to the state’s labor force.
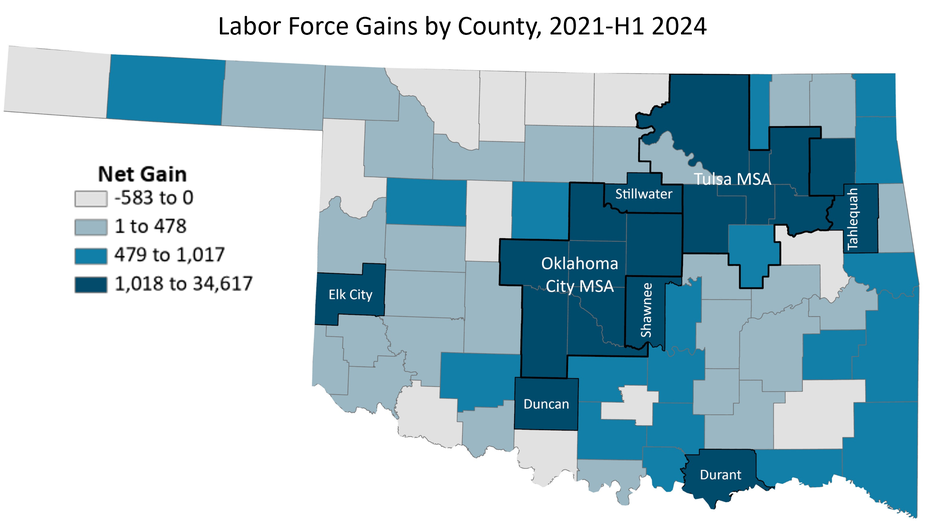
Note: Categories shown are quartiles, with the bottom quartile adjusted slightly to break at 0.
Source: BLS LAUS
The state’s increased labor force participation is primarily driven by Native Americans
There could be several reasons for Southeastern Oklahoma’s outsized gains, like its proximity to the rapidly growing Dallas-Fort Worth metro area, which has spilled over into southeastern Oklahoma. But its extensive Native American and tribal presence also appears to have played a key role. Labor force participation among Native Americans across Oklahoma has trended up since 2021, and in 2024 reached its highest level in at least 20 years (Chart 3)._ When Oklahoma’s total labor force participation rate first exceeded the U.S. average in 2023, the Native American rate soared from 61.5% in 2022 to 66%, overtaking the state average by three percentage points. By the first half of 2024, Oklahoma’s Native American participation rate increased further to 67.6%, helping bring the state’s overall rate up to 63.2% while the nation’s plateaued at 62.6%.
Chart 3: Native American participation in Oklahoma reached its highest level in at least two decades in 2023 and 2024.
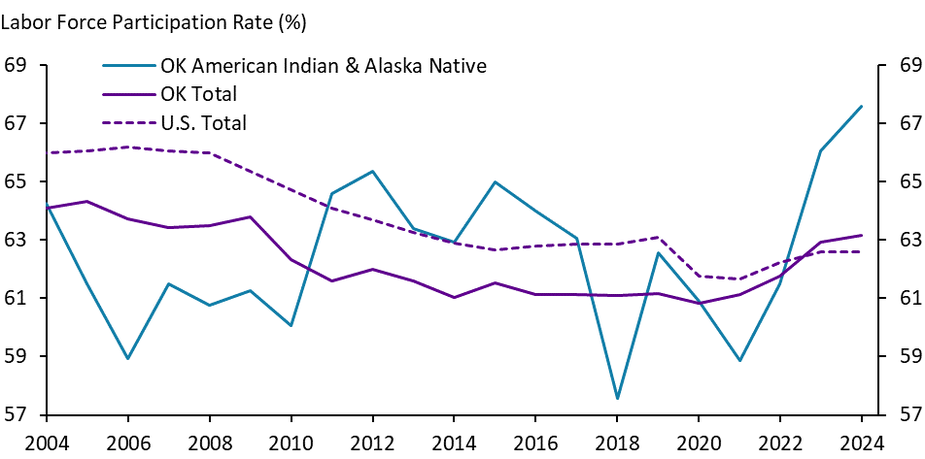
Note: 2024 rates are the average monthly rate for H1 2024 (January to June).
Sources: IPUMS CPS, BLS CES, BLS LAUS/Haver Analytics, authors’ calculations.
Native Americans’ contribution to Oklahoma’s labor force gains has been outsized relative to their share of the population. According to the Current Population Survey, Native Americans accounted for 30% of the state’s population gains from 2021 to H1 2024, despite only making up 14% of the population in H1 2024 (Chart 4)._ They contributed to an even greater share of labor force gains—43%—in the same period, indicating that many Native Americans not previously in the labor force before are now working or looking for work. Because Native Americans’ contribution to labor force gains during this time is greater than their contribution to population growth, they have accounted for 71% of the total increase in Oklahoma’s labor force participation rate, bringing the state’s total rate higher than the U.S. average.
Chart 4: Native Americans contributed to 71% of Oklahoma’s increase in labor force participation since 2021, an outsized share relative to their population.
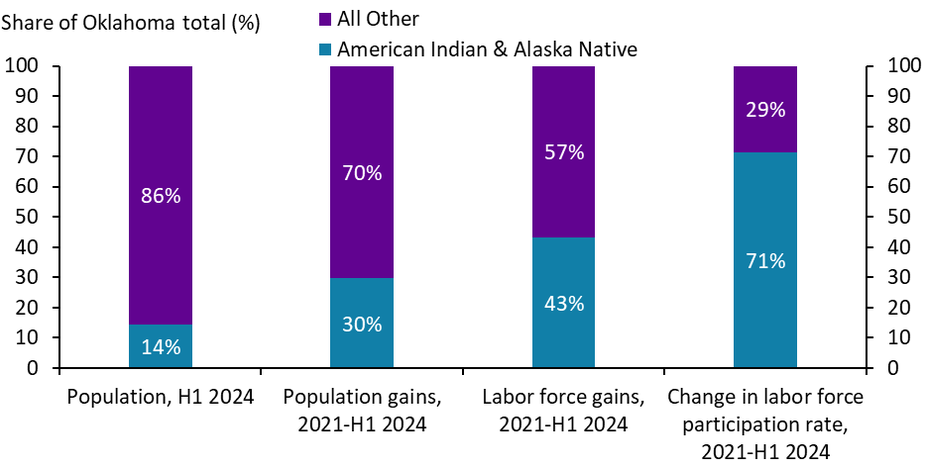
Source: IPUMS CPS, authors’ calculations
Native Americans saw the largest employment gains in schools, hospitals, and government
Native American and tribal government employment have grown much faster than total state employment since 2015. While jobs at tribal governments and enterprises represent only a fraction of the total employment of Native Americans in the state, Native American employment has closely tracked tribal government employment over the past decade. From 2015 to 2019, tribal government employment and overall Native American employment in Oklahoma increased by around 20% even as total state employment levels stayed mostly flat (Chart 5). Jobs for tribal governments when combined with their enterprises rose about 11% in that time. Following weak growth due to Covid in 2020, Native American and tribal government employment has grown at an even faster pace since 2021. These jobs are now over 50% higher than their 2015 levels and tribal government and enterprise jobs are about 20% higher, while total jobs for Oklahoma and the U.S. are just 5-10% higher.
Chart 5: Native Americans’ employment has grown in tandem with tribal governments at an above-average pace in Oklahoma
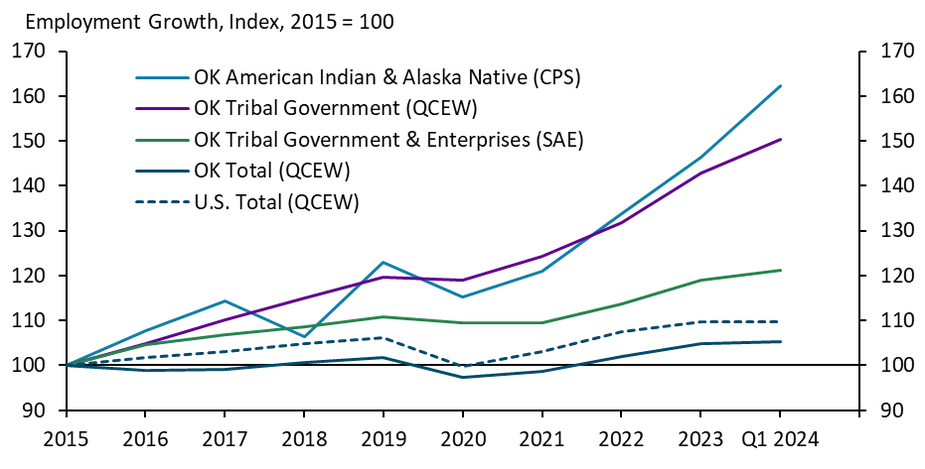
Note: Parentheticals indicate the source of each category.
Sources: IPUMS CPS, BLS QCEW, BLS SAE/Haver Analytics, authors’ calculations
Native Americans’ job gains in Oklahoma since 2021 have primarily been in schools, hospitals, government, and a select few other industries. About 17,000 Native Americans found new jobs in elementary and secondary schools from 2021 to the first half of 2024, with half of those gains outside of the Oklahoma City and Tulsa metropolitan areas (Chart 6). Around 3,700 additional jobs were also added in the child day care services industry. Hospitals added 15,000 jobs for Native Americans in this period, with 57% of the new jobs outside of the OKC and Tulsa MSAs. Native Americans also added a substantial number of jobs in three government sub-industries: administration of human resources (6,800 jobs), national security and international affairs (6,700 jobs), and justice, public order, and safety (3,700 jobs)._ About 70% of these government jobs were in the state’s capital, Oklahoma City, while an additional 26% of the gains were outside of OKC and Tulsa. Native American employment has also risen by over 2,500 jobs since 2021 in various other industries, including department stores, legal services, and computer and data processing services.
Chart 6: Job gains for Native Americans have primarily been concentrated in schools, hospitals, and government since 2021.
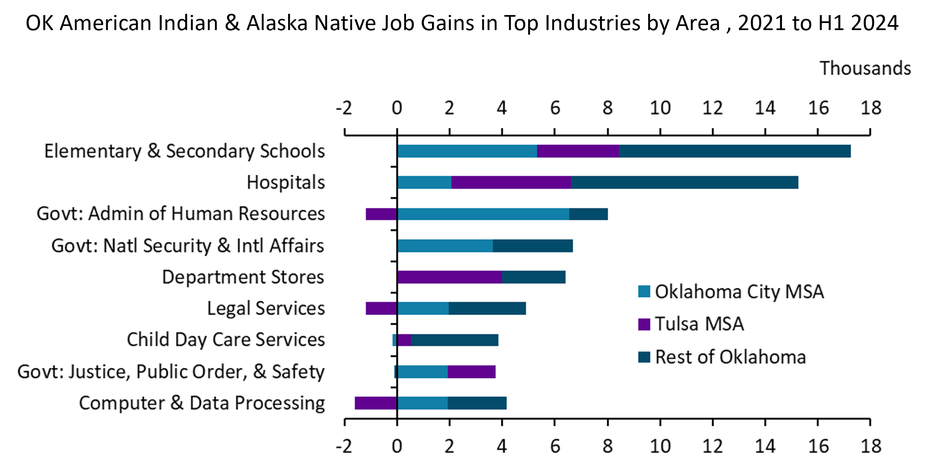
Notes: Industries are based off the Census Bureau’s 1990 Industry Classification. Elementary & Secondary Schools (SIC code 8211) include private and public schools. Administration of human resources (SIC code 94) entails government agencies that administer educational, public health, social, and veterans’ resources.
Source: IPUMS CPS, authors’ calculations
Summary and Conclusions
Oklahoma’s economy has historically differed somewhat from the nation’s at large, whether due to its high concentrations in oil and gas and national defense, or its unique demographic composition. After decades of a structurally lower rate, Oklahoma’s labor force participation overtook the U.S. average in 2023 for the first time in over 30 years, as its labor force grew faster than the nation’s even as its population growth was similar. The state’s Native American population contributed to over two-thirds of this increase in participation since 2021, with many who entered the workforce finding employment in schools, hospitals, and government. Further research on the dynamics of employment in these industries, especially those closely associated with tribes, could provide additional insights into these encouraging trends.
Endnotes
-
1
We define Native Americans as anyone who identifies as American Indian & Alaska Native alone or in combination.
-
2
The Current Population Survey (CPS) from the Bureau of Labor Statistics (BLS) is a nationally representative survey with demographic detail on labor market data. Unlike other BLS surveys, there is not a separate survey at the state level. So, all Oklahoma estimates sourced from the CPS in this paper use a subsample of the national survey with only individuals living in Oklahoma. As a result, these estimates have a small sample size. However, the chart linked here shows that Oklahoma’s labor force participation rate as calculated by the CPS tracks the estimates from the BLS’s state-level survey for Oklahoma, sourced from a series called BLS Local Area Unemployment Statistics (LAUS).
-
3
Industrial categories are based on the “Industry, 1990 basis” (IND1990) variable from the CPS, which are based on SIC codes.