View the infographic that accompanies this article: Remote Possibilities?
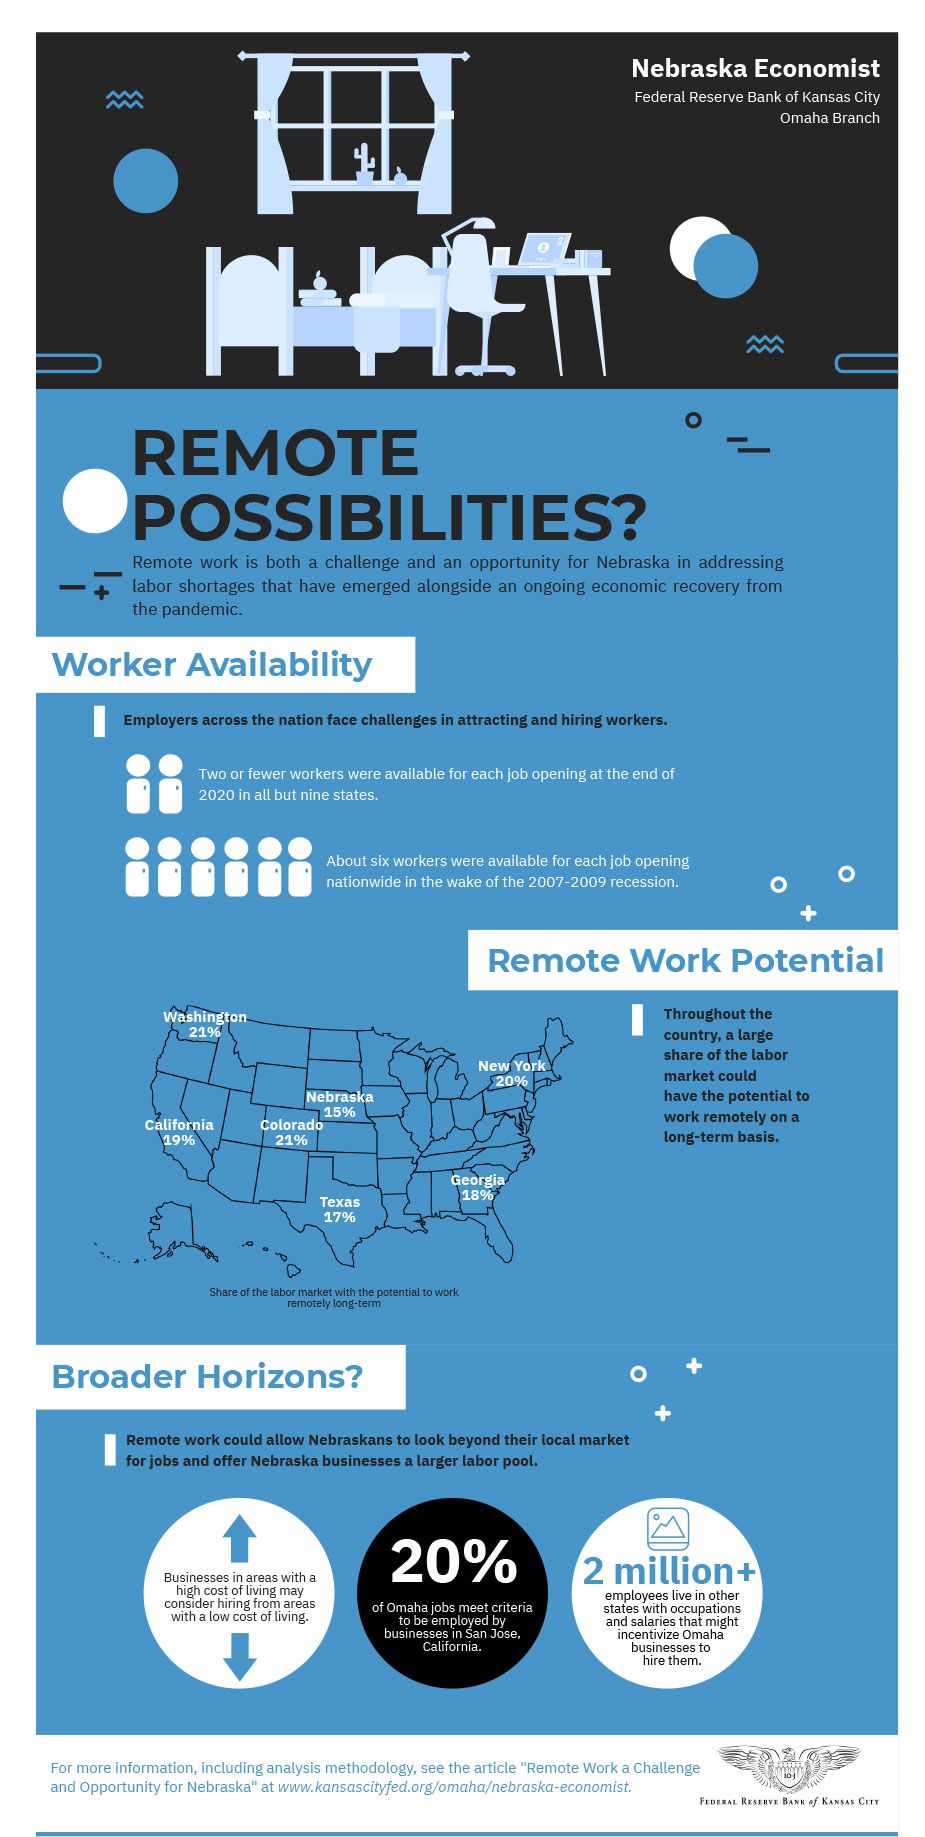
The potential for remote work represents both a challenge and an opportunity for Nebraska in addressing labor shortages that have emerged alongside an ongoing economic recovery from the pandemic. One year ago, Nebraska’s economy, like many others, was reeling from the initial effects of the pandemic and associated business closures. Halfway through 2021, however, unemployment in the state generally has returned to its pre-pandemic level and businesses have identified labor shortages as one of the primary constraints to further gains in economic activity. Nebraska businesses may consider hiring remote workers in other states as a possible solution to these labor shortages, but out-of-state firms may also increasingly compete for existing talent in Nebraska.
A Scarcity of Workers
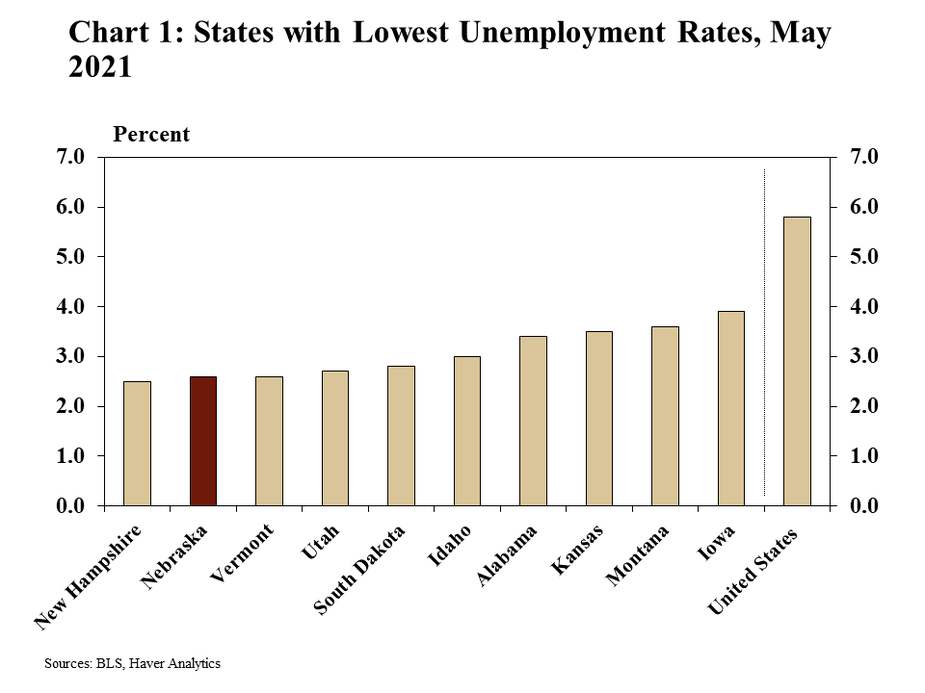
Unemployment in Nebraska has declined further in the first half of 2021. As of May, Nebraska’s unemployment rate was the second lowest in the nation (Chart 1). At 2.8%, the state’s unemployment rate was less than half the national rate of 5.8% and has been less than 3% for the past two months.
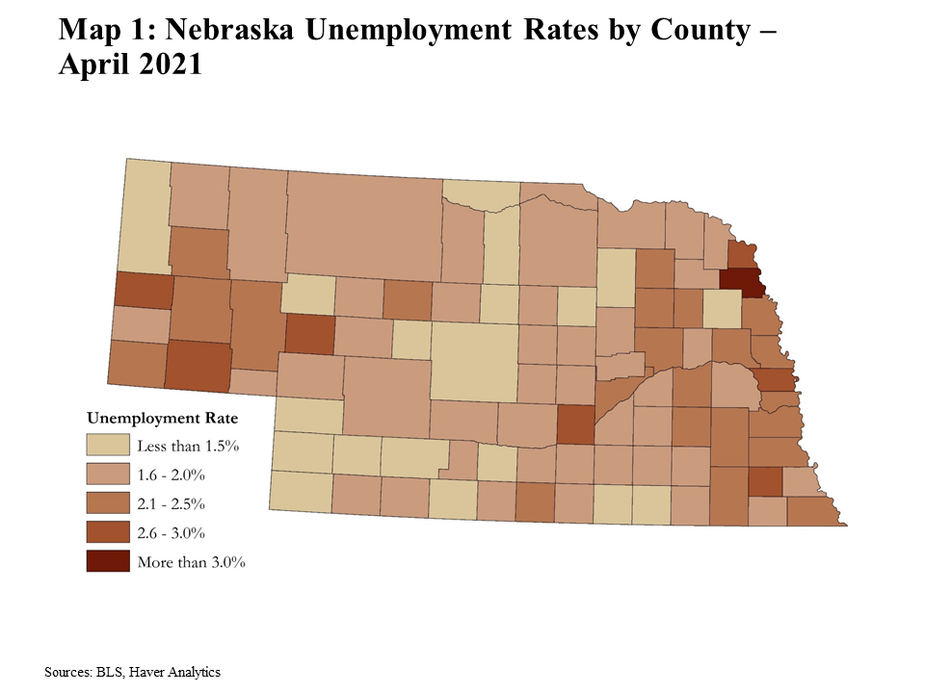
Throughout the state, unemployment has returned to historically low levels. Through April, the unemployment rates in Douglas and Lancaster counties, the state’s two most populous, were just 3.0% and 2.2%, respectively. More significantly, only one county (Thurston) had a rate higher than 3%, and in many counties the rate has fallen to less than 2% (Map 1).
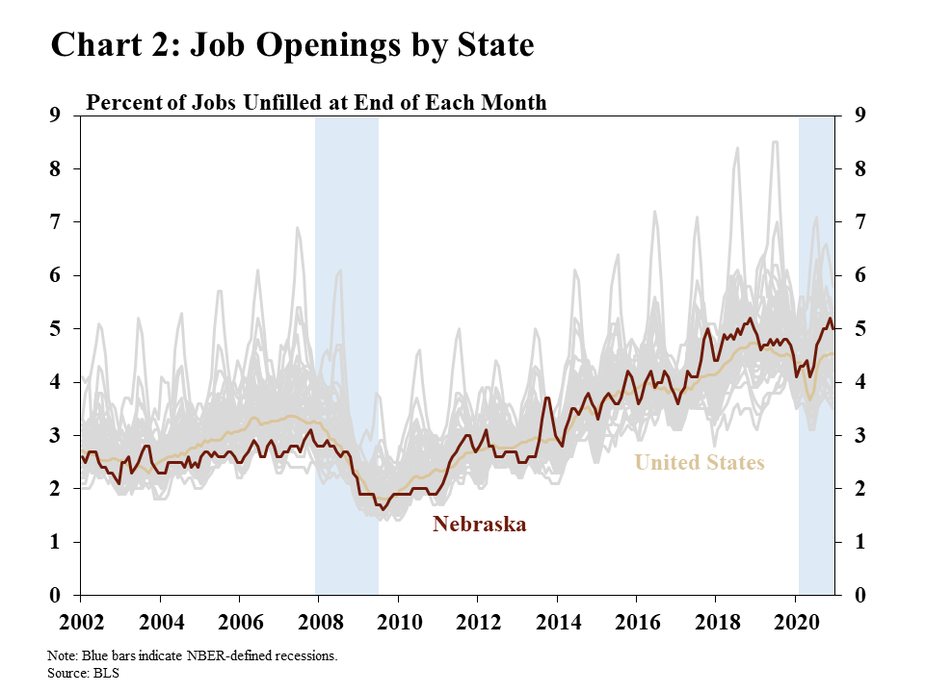
For many Nebraskans, 2021 has been one of the best years recently for seeking employment. As local, national and global economies have continued to reopen, businesses have increased their pace of hiring and job openings have been on the rise. At the end of the first quarter, more than 5% of job openings in Nebraska were unfilled, almost twice the rate of openings before the 2007-09 Great Recession and higher than before the pandemic (Chart 2).
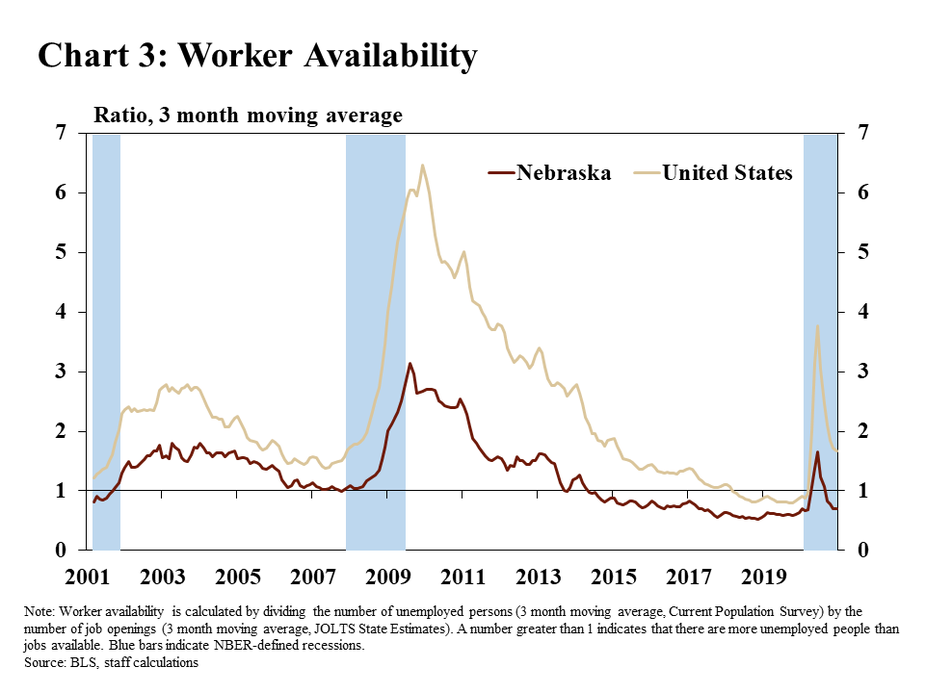
For businesses, however, labor shortages have been a significant challenge. The increased pace of business activity and steady decline in unemployment has led to a sharp reduction in available workers. Similar to the years ahead of the pandemic, there have been more job openings recently in Nebraska than people looking for jobs. In fact, by the end of 2020, the ratio of unemployed persons in Nebraska relative to the number of openings was just 0.6, near historic lows and considerably less than the nation (Chart 3).
The Pandemic’s Ongoing Effect on Employment
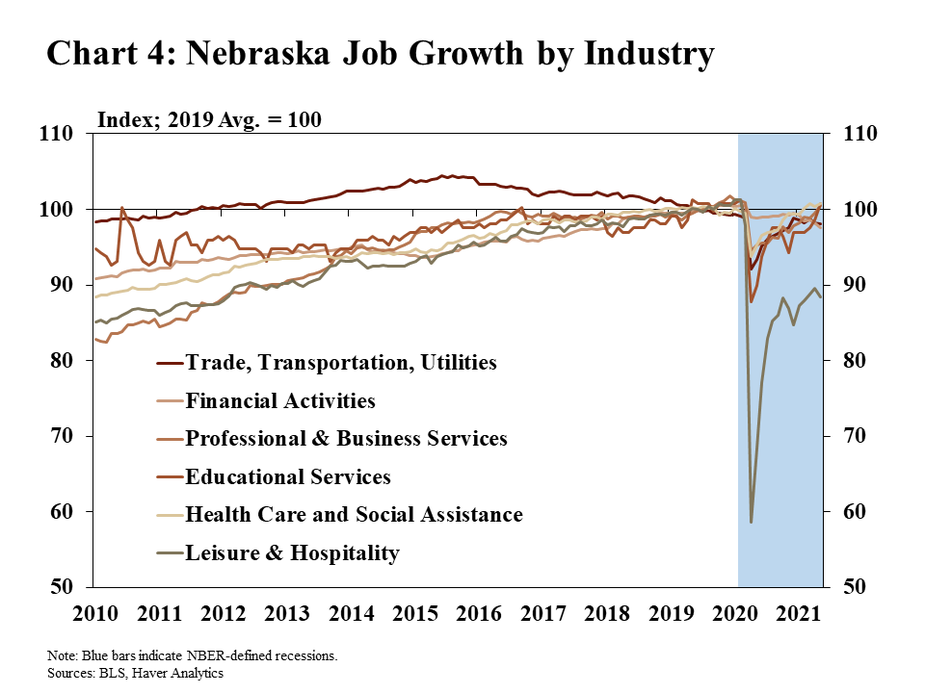
Despite a historic recovery in Nebraska’s labor market, employment in some industries still has not returned to its pre-pandemic level. In the initial months of the pandemic in 2020, employment in some industries dropped sharply. In the leisure and hospitality sector, employment declined more than 40% from January to April 2020. Although the sector has recovered many lost jobs, employment has remained about 10% less than its pre-pandemic level (Chart 4). Employment in several other service-oriented sectors also has improved but has remained less than in 2019.
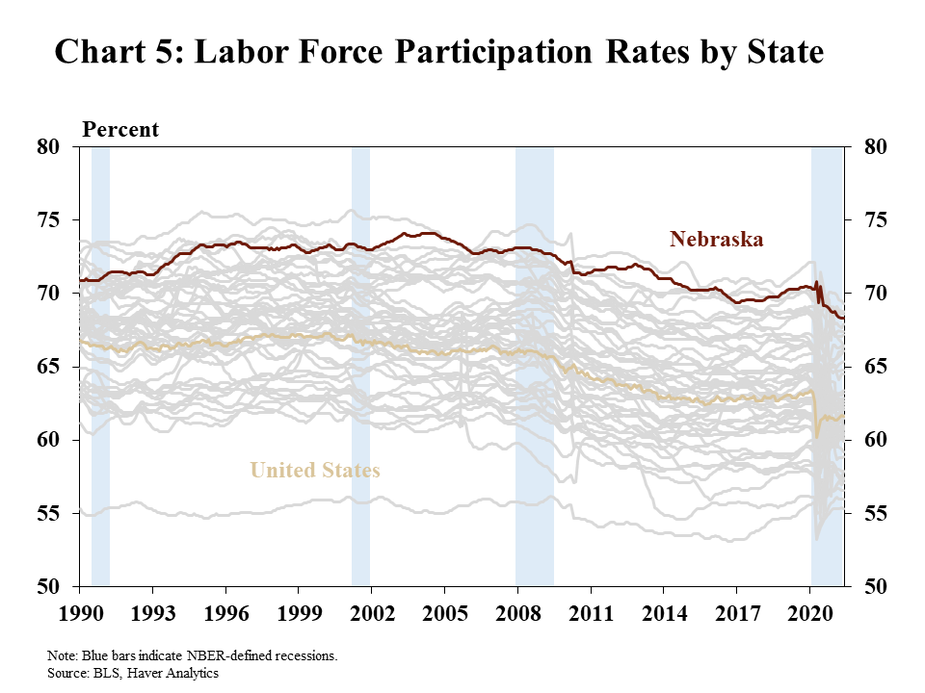
In addition, Nebraska’s labor force has shrunk to its lowest level in at least 30 years as a share of the state’s working-age population. Nebraska’s labor force as a share of the state’s population dropped to 68.3% in May, almost 2 percentage points less than before the pandemic (Chart 5). While Nebraska’s labor force participation rate has remained one of the highest in the country, the recent decline has been a contributing factor to the state’s low level of unemployment. For example, if Nebraska’s current labor force participation rate was the same as in January 2020, the state’s unemployment rate would be 5.1%, nearly double the most recent reading.
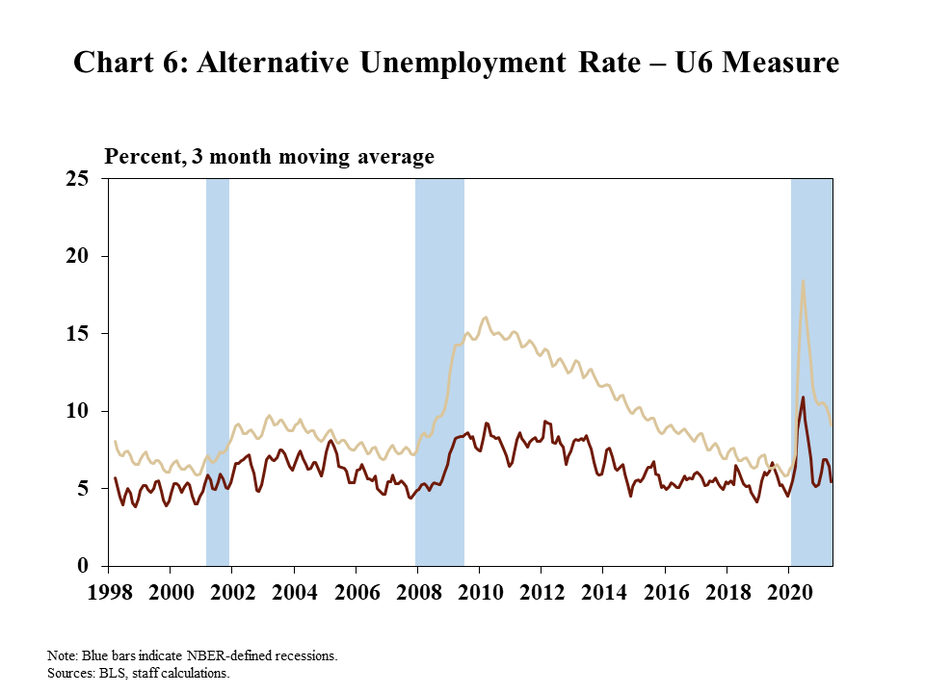
Some measures of unemployment have remained elevated despite the ongoing economic recovery. Numerous measures of unemployment may be used to characterize labor markets in the United States. The most common of these is the U-3 measure of unemployment, cited earlier in this article. A more all-encompassing measure, known as U-6, classifies a larger set of workers as unemployed, including individuals who are employed part time for economic reasons. The U-6 rate has remained slightly elevated despite significant declines in the more common measures of unemployment in 2021 (Chart 6).
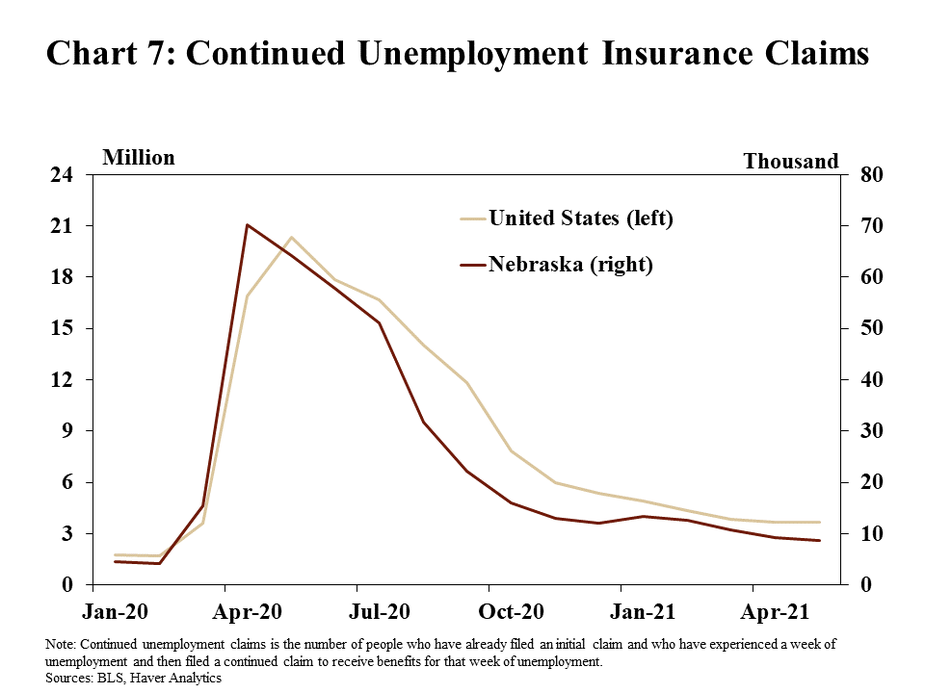
Many former employees have continued to receive support from unemployment insurance programs. A sharp increase in unemployment beginning in March 2020 led to a large increase in the number of individuals filing for unemployment insurance benefits (Chart 7). The number of individuals continuing to receive benefits has declined steadily over the past year but remained elevated through the first half of 2021. As of May, the number of individuals receiving unemployment insurance support in Nebraska still was 90% higher than at the beginning of 2020.
National Competition for Remote Workers
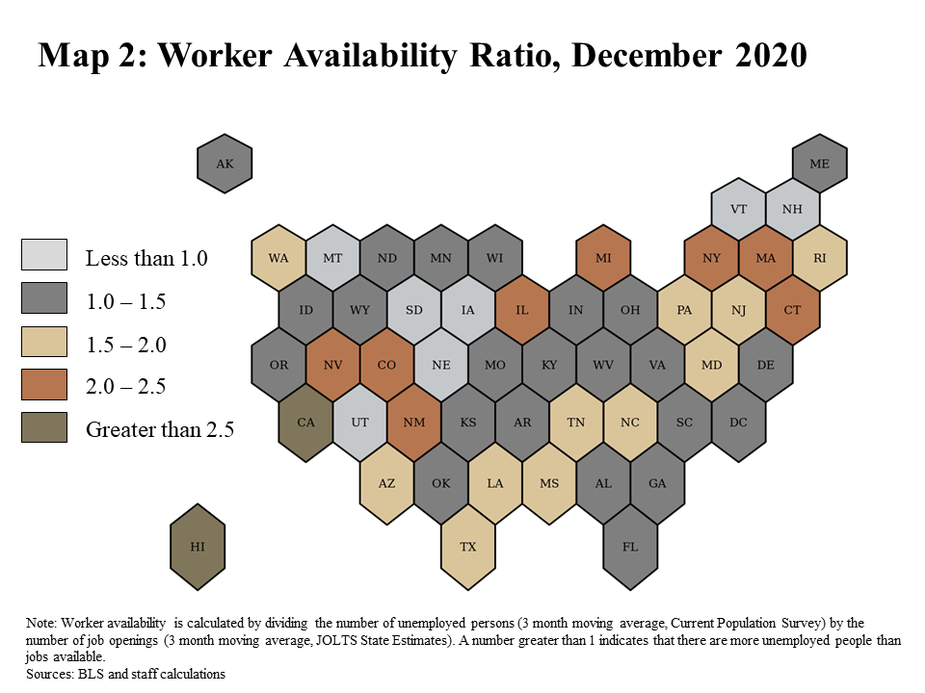
Despite the severe economic effects from the pandemic, unemployment rates have fallen across the country with employers continuing to highlight challenges attracting and hiring workers. Labor shortages recently have been most severe in the Midwest, a region generally characterized by low unemployment and more limited economic effects from the pandemic. Although the availability of workers has been especially low in the Midwest, labor shortages have become a significant challenge for businesses elsewhere in the country. In all but nine states, there were fewer than two workers available for each posted job opening at the end of 2020 (Map 2). In the wake of the 2007-09 recession, there were six workers available for each job opening nationwide.
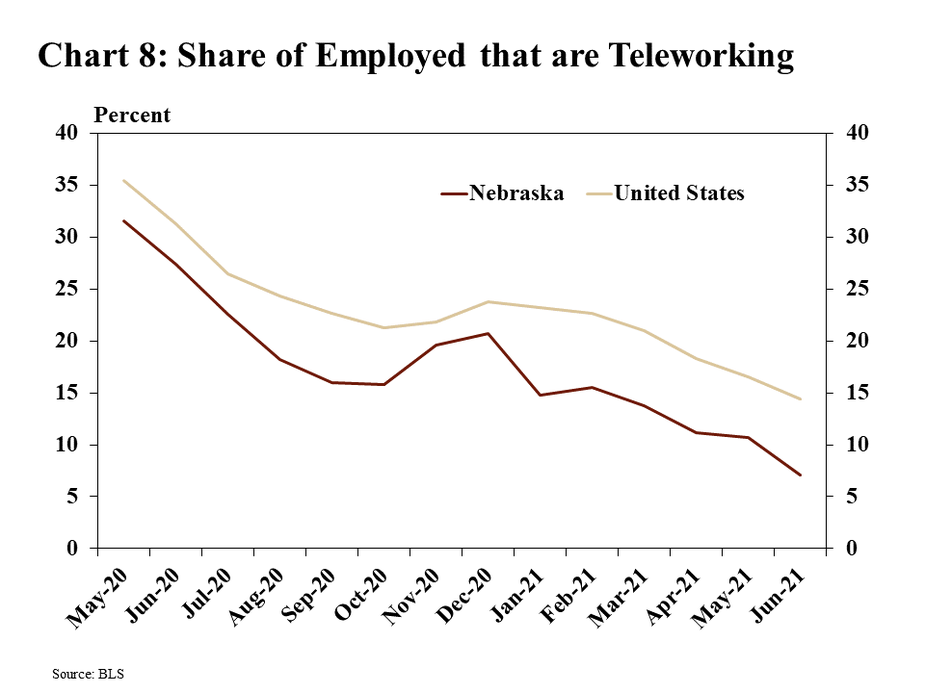
Throughout the pandemic, opportunities for remote employment that had not existed previously continued to grow as businesses considered alternative options for solving their hiring challenges. The pandemic forced many businesses and employees to find innovative ways of working offsite. Some businesses may choose to pursue or maintain a remote workforce regardless of the pandemic in an effort to access labor markets in other parts of the country. Although the share of employees working remotely has declined over the past year, 7% of Nebraska’s workforce still reported some amount of remote work in May 2021 (Chart 8)._
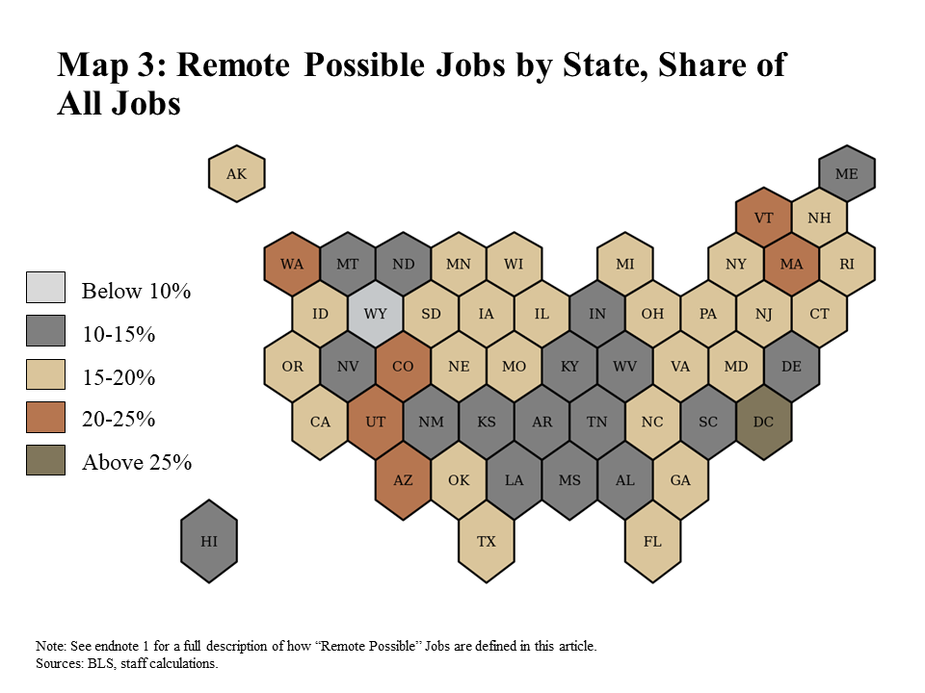
Throughout the country, there appears to be a large share of the labor market with the potential to work remotely. In Nebraska, about 17% of the workforce was comprised of occupations with the capability to work remotely on a long-term basis (Map 3)._ In regions with a high concentration of jobs connected to technology or business services, many individuals may be employed in occupations with the ability to work remotely on a permanent basis. For example, based on the method of classifications in this article (see endnote), almost 30% of jobs in the District of Columbia, 23% of jobs in Vermont, and 21% of jobs in Colorado, Massachusetts and Washington may be able to work remotely.
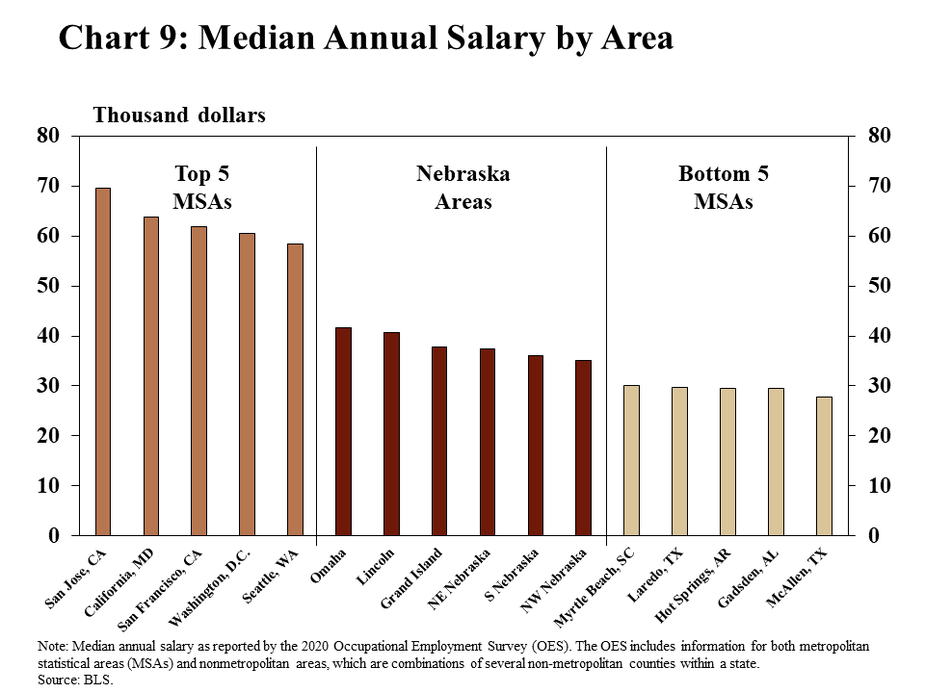
Large differences in wages from one part of the country to another also underscore the possibilities of remote employment. The median annual salary in Nebraska in 2020 ranged from a low of $35,160 in the northwest part of the state to a high of $41,730 in Omaha (Chart 9). Despite this variation, these salaries were much less than on the West or East coasts, suggesting that businesses located in those regions may have an incentive to hire Nebraskans to work remotely at lower cost. Likewise, lower salaries in the South and southeastern U.S. suggest that firms in Nebraska may have an incentive to hire remote workers living in those regions.
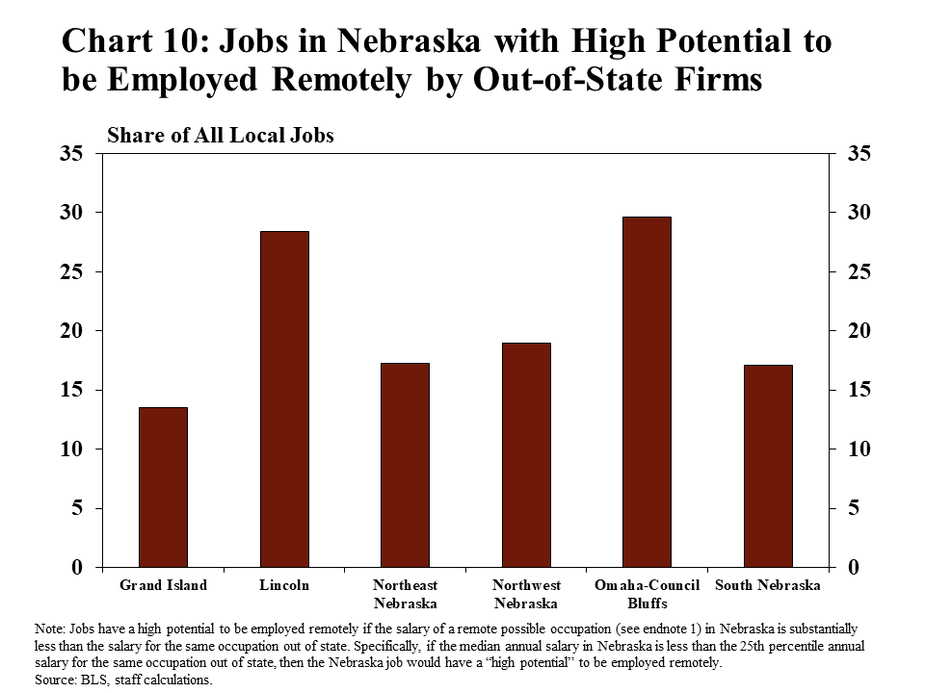
Remote employment, then, could create opportunities for Nebraska employees to work for out-of-state firms at a higher wage while continuing to live in Nebraska. In Omaha and Lincoln, as much as 30% of the workforce may have a high potential to be employed remotely by an out-of-state firm (Chart 10). Other parts of the state have a smaller, though still significant, workforce with a high potential to be employed remotely due to differences in the composition of occupations in those areas.
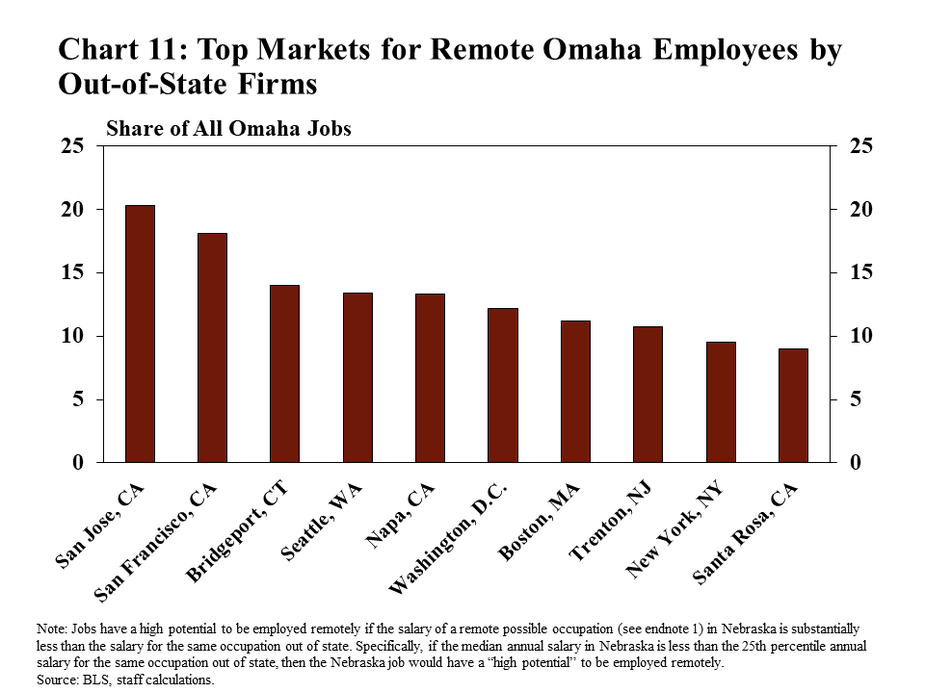
Businesses with a traditional employment base in areas with an especially high cost of living may consider hiring Nebraskans if remote employment opportunities persist. In the Bay Area of California, for example, a large share of occupations may be employed remotely full time because of the high concentration in technology-oriented jobs. Businesses in that area may consider hiring someone from Nebraska with a similar expertise to work remotely at a salary higher than what would be paid in Nebraska, but less than a typical rate in California. About 20% of all jobs in Omaha could meet the necessary criteria (as established in this article) to be employed remotely for businesses in San Jose, California (Chart 11).
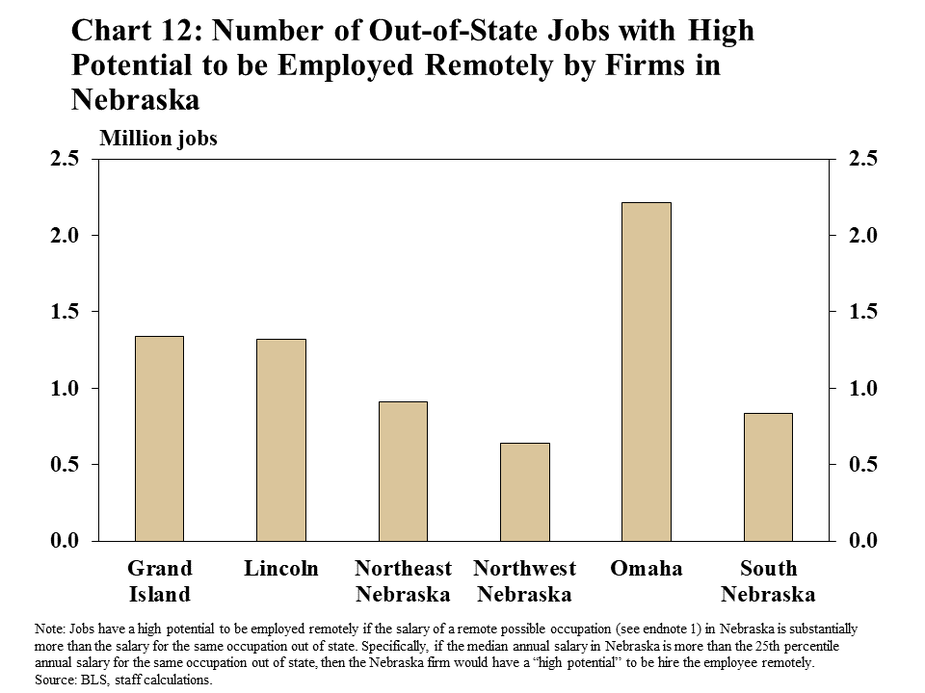
Likewise, businesses in Nebraska may consider hiring staff in other parts of the region or country to address local labor shortages. For firms in Omaha, there are more than 2 million employees living in other states employed in remote-possible occupations, and whose salaries are low enough to incentivize Omaha-based businesses to hire them (Chart 12). Even in northwest Nebraska, where a larger share of the workforce is employed in occupations less able to work remotely, there are more than 500,000 employees in other parts of the country that firms in the Panhandle may consider hiring at a lesser wage.
Conclusion
As economic conditions improve in the wake of the pandemic, businesses across the country are contemplating their workforce strategies. These strategies include decisions about the future for in-person and remote work, in addition to plans for hiring and staff retention. With many organizations recognizing labor shortages as a significant concern going forward, discussions about the challenges and opportunities of remote work have continued to evolve. For Nebraska, hiring remote workers from out of state may be a potential solution to local labor shortages. At the same time, however, Nebraska’s skilled workforce, with salaries generally lower than many other states, could be an appealing solution for firms elsewhere facing the same intensifying challenges.
Interested in learning more about the economics of where you work? External LinkClick here.
Endnotes
-
1
A previous version of this chart and associated text incorrectly described a recent increase in the share of Nebraska’s workforce that reported teleworking. The error has been fixed in this chart and associated text.
-
2
Existing literature (Dingel and Neiman 2020) developed a list of occupations that were able to work remotely during the pandemic. In this article, the list has been narrowed further by recognizing that some occupations deemed to be “remote possible” in the paper will be unlikely, in our opinion, to be fully remote in a post-pandemic economy. For example, teachers worked remotely throughout much of the pandemic in many areas. However, in the future, schools currently appear very unlikely to hire a teacher to work entirely remotely. Our customized list of “remote possible” jobs can be found at this link.
Reference
Dingel, J.I., and B. Neiman. 2020. “How Many Jobs can be Done at Home?” Journal of Public Economics, 189, 104235. External Linkhttps://doi.org/10.1016/j.jpubeco.2020.104235