In 2012, Colorado voters passed Amendment 64, making Colorado one of the first states to legalize recreational marijuana. Since then, the legalization trend has continued, and today, medical marijuana is legal in 29 states and Washington, D.C., and recreational marijuana is legal in eight states and Washington, D.C. So far in 2018, Vermont’s lawmakers have legalized marijuana starting July 1, and at least 11 other states are considering recreational or medical marijuana legalization.i The marijuana industry has had many effects on the state of Colorado since it was legalized. This issue of the Rocky Mountain Economist focuses on the economic impacts of the marijuana industry in Colorado, the first state to open recreational marijuana stores.
Marijuana Sales in Colorado
After Amendment 64 passed in November 2012, recreational marijuana stores in Colorado opened Jan. 1, 2014. Although marijuana is legal in all of Colorado, each local jurisdiction can decide whether to allow medical or recreational marijuana retail stores. As of June 2017, 65 percent of Colorado jurisdictions (out of 320) had banned both medical and recreational stores, 4.7 percent had allowed only medical stores, 3.4 percent had allowed recreational stores only and 26.6 percent had allowed both recreational and medical marijuana stores.ii
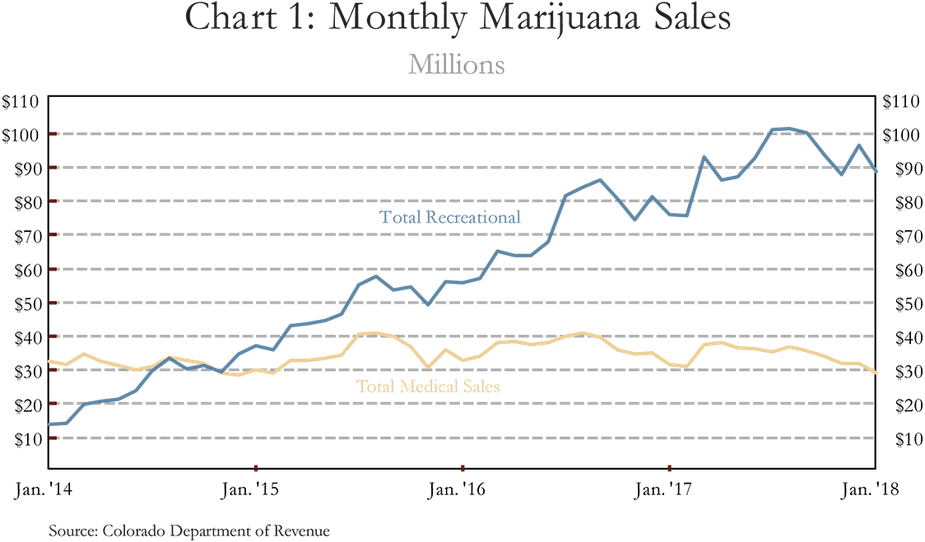
In the first month that recreational marijuana stores opened in Colorado, recreational sales exceeded $14 million and medical sales more than doubled that amount at $32.5 million (Chart 1). Since then, recreational sales have grown sharply while medical sales have remained roughly flat.iii In 2014, total annual recreational sales were $303 million, while medical sales totaled $380 million. By 2017, recreational sales had grown to almost $1.1 billion, and medical sales were almost $417 million. Thus, in 2017, combined marijuana sales in Colorado exceeded $1.5 billion.iv
To put the magnitude of marijuana sales in perspective, personal consumption expenditures on all goods and services totaled $236.3 billion in 2016 in Colorado. Marijuana sales were $1.3 billion in 2016, or 0.55 percent of all personal consumer expenditures. By comparison, spending on food and beverages purchased for off-site consumption made up 7.2 percent of personal consumption expenditures in Colorado.v, vi
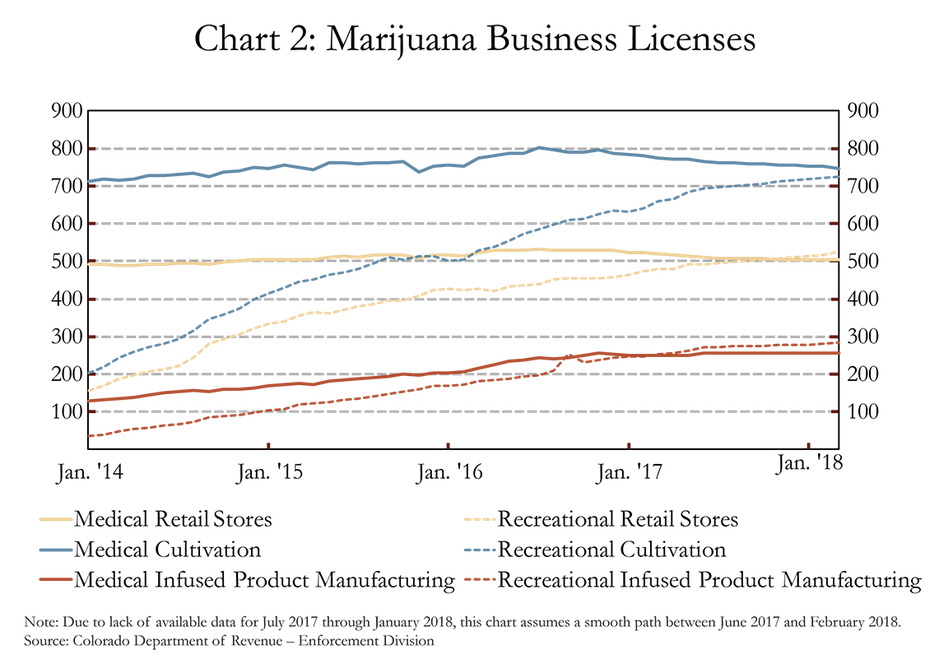
As marijuana sales increased, there also was a sharp increase in the number of marijuana stores and other related facilities (Chart 2). In January 2014, there were 156 business licenses issued for recreational retail stores and 493 business licenses for medical marijuana stores. By February 2018, recreational retail store licenses had more than tripled to 518 stores, while medical licenses had grown slightly to 503 stores. In addition to retail stores, the state of Colorado also provides business licenses for cultivation facilities, infused product facilities, testing facilities, operators and transporters. In February 2018, there were 1,473 licenses for cultivation facilities including both medical and recreational, 535 licenses for infused product manufacturing facilities, 23 licenses for testing facilities, 12 operator licenses and 18 transporter licenses. These licenses are issued by the Marijuana Enforcement Division and signify the number of licenses issued but do not necessarily imply that all of these licenses are being actively used.vii
To get a sense of the magnitude of the marijuana industry, we can compare the total number of marijuana-related business licenses in the state to the number of new entity business filings for all industries in the state. Between the first quarter of 2014 and the fourth quarter of 2017, there were about 431,997 new entity business filings in Colorado. By comparison, slightly more than 3,000 marijuana-related business licenses were active at the end of 2017. If all of these marijuana-related businesses started during the first quarter of 2014 through the end of 2017, then they would represent about 0.7 percent of total new business filings in the state since 2014. The actual percentage likely is lower than 0.7 percent because some marijuana-related businesses existed in Colorado prior to 2014, particularly those serving the medical side of the industry.
As the marijuana industry grew, the industry, and specifically cultivation facilities, began to impact the market for industrial warehouse space, particularly in Denver. According to the CBRE Group Inc., a commercial real estate services firm, the marijuana industry occupied 14.2 million square feet of industrial warehouse space in Denver in the fourth quarter of 2016, roughly 2.9 percent of industrial warehouse space in the metropolitan area. Since then, however, the absorption of space has stabilized due in part to legislation passed in May 2016 by Denver’s City Council that caps the number of cultivation facilities. The influx of cultivation facilities also has pushed up lease rates, with average lease rates for marijuana cultivation facilities two to three times higher than average warehouse lease rates between 2014 and 2016, according to CBRE Research.viii,ix
Employment in the Marijuana Industry
As the marijuana industry has ramped up in Colorado over the past four years, employment in the industry and in supporting sectors also has expanded. Although there is not an official count of those working in the marijuana industry, the state does provide data on the number of individuals licensed to work in the sector. All employees working in the marijuana industry in Colorado must hold an occupational license issued by the Colorado Marijuana Enforcement Division. There are three types of occupational licenses including support occupational licenses, key occupational licenses and associated key (business owner) licenses. Key licenses are required for “employees that make operational or management decisions that directly impact the business” such as master growers. Support employees include all other employees such as budtenders (those who sell and serve marijuana).x
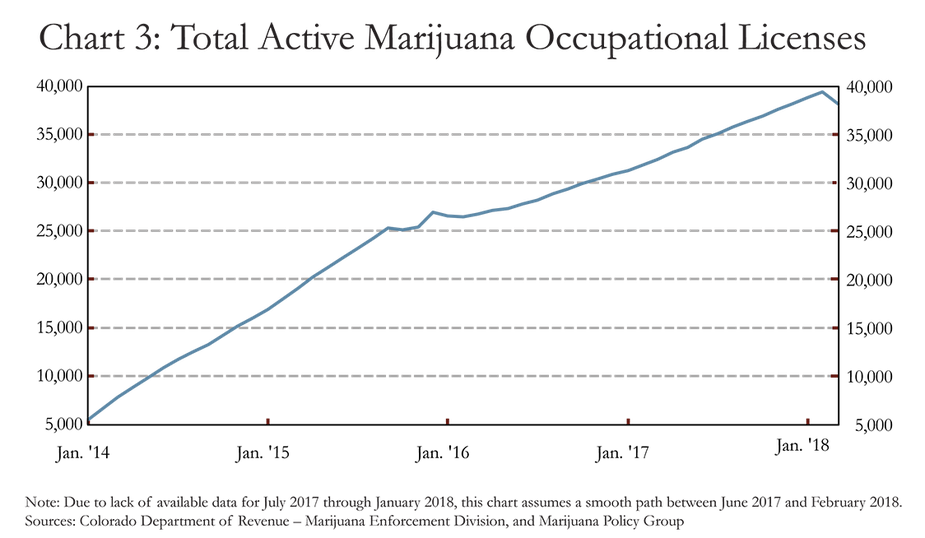
As of March 2018, there were more than 38,000 issued individual licenses in the marijuana industry, including 1,637 business owners (Chart 3). Of course, not everyone with a license is working in the industry, and the Marijuana Policy Group estimates that one active license equates to 0.467 full-time equivalent positions.xi, xii Using this estimate, the marijuana industry currently employs about 17,821 full-time equivalent staff, a 17.7 percent increase in employment over the previous year.
Employment in the marijuana industry is a relatively small share of total employment in Colorado, but in recent years it has been one of the state’s fastest-growing industries. As of February 2018, employment in the marijuana industry made up 0.7 percent of total employment in the state assuming that each active license translates into 0.467 full-time jobs, up from 0.1 percent in 2014 (Chart 4). These calculations are based on occupational licensing data, and therefore reflect direct employment in the industry. In addition to this direct employment, the marijuana sector creates jobs in other sectors that help to support the industry. A 2016 report by the Marijuana Policy Group estimated that indirect employment including “security guards, construction and HVAC specialists, consulting, legal, and advisory services, and other business services” equaled about 23 percent of direct employment. In addition, the income earned by workers in the marijuana industry helps create jobs in the broader Colorado economy, and the Marijuana Policy Group estimates that these additional jobs equal almost 20 percent of direct employment in the marijuana industry.xiii
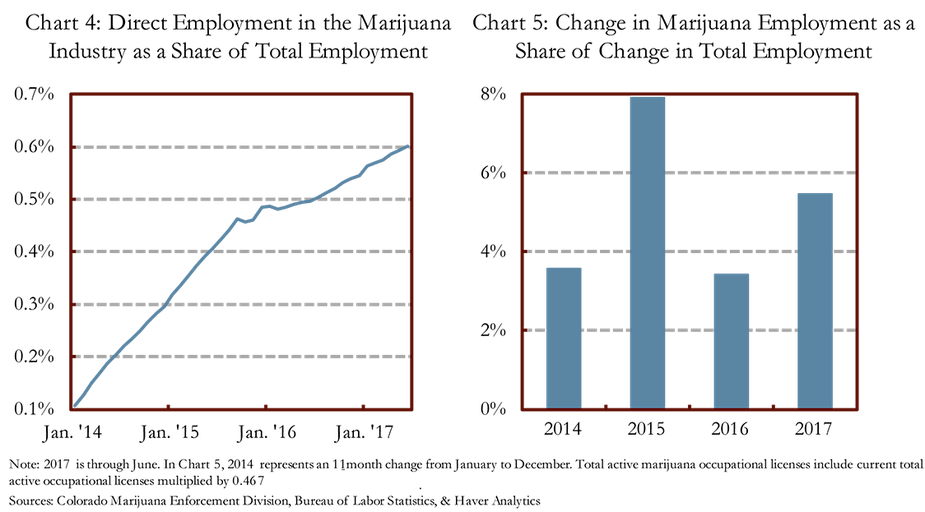
Although its share of total employment is relatively small, new jobs in the marijuana industry recently have contributed more substantially to total employment growth (Chart 5). As an example, about 5.5 percent of the total change in Colorado employment in the first half of 2017 can be attributed to the marijuana industry. By comparison, the mining and logging sector, which makes up 1 percent of Colorado employment, contributed almost 7 percent of total employment growth in the first half of 2017, while the leisure and hospitality sector contributed the largest amount at 23 percent.
Taxation of the Marijuana Industry
Recreational and medical marijuana face significantly different tax burdens in Colorado. When recreational marijuana stores opened in 2014, recreational marijuana was assessed a 15 percent excise tax, a 10 percent special sales tax, the 2.9 percent state sales tax and local sales taxes. Beginning July 1, 2017, the special sales tax rate on recreational marijuana was increased to 15 percent and recreational marijuana became exempt from the state sales tax.xiv Combining all of these state-level taxes with the local sales tax rate, the overall tax rate on recreational marijuana was about 29 percent when retail stores opened in 2014.xv Tax collections from the special sales tax are shared by state and local governments. Initially, the state kept 85 percent of those collections and distributed 15 percent to local jurisdictions. When the tax rate increased in July 2017 to 15 percent, the state share became 90 percent of the collections, while the local share declined to 10 percent. In contrast to the higher tax rates imposed on recreational marijuana, medical marijuana faces only the ordinary state and local sales taxes.xvi
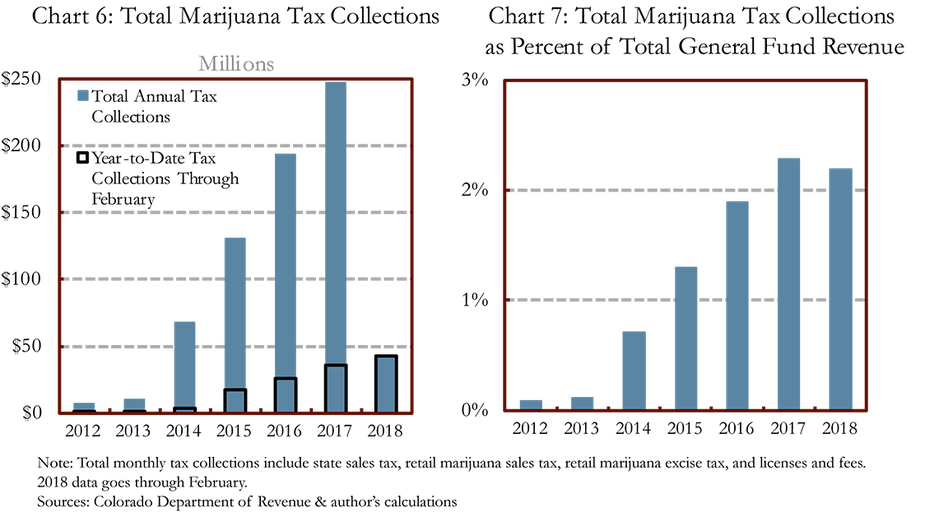
In 2017, the state of Colorado collected more than $247 million from the marijuana industry, including state sales taxes on recreational and medical, special sales taxes on recreational, excise taxes on recreational and application and licenses fees. Tax collections since 2014 have increased significantly, though at a slower pace over the past year (Chart 6). Between 2014 and 2015, total collections increased 93 percent. By contrast, collections increased about 28 percent between 2016 and 2017. To put the magnitude of marijuana tax collections in perspective, they equate to about 2.3 percent of Colorado’s 2017 general fund revenue (Chart 7). Although this calculation is useful for perspective, most marijuana revenue does not go into the state general fund.xvii, xviii
Taxes on marijuana are distributed to a variety of funds in Colorado. The first $40 million of collections from the excise tax on recreational marijuana are dedicated to school construction and renovation through the state’s Building Excellent Schools Today program, with any revenue from the excise tax exceeding $40 million going to the Public School Fund. Ten percent of collections from the special sales tax on recreational marijuana is distributed to local governments. Starting in July 2018, the beginning of fiscal year 2019, the state’s 90 percent share of the special sales tax on recreational marijuana will be divided as follows: 15.56 percent to the general fund, 12.59 percent to the state public school fund and 71.85 percent to the marijuana tax cash fund.xix State sales tax revenue from medical marijuana also is distributed to the marijuana tax cash fund. The marijuana tax cash fund pays for the regulation, licensing and administration costs that the state faces to monitor the sector. The remainder of the marijuana tax cash fund is primarily spent on monitoring the health effects of marijuana, health education, substance abuse prevention, treatment programs and law enforcement.xx, xxi
As detailed above, much of the tax revenue collected from the marijuana industry goes toward costs incurred by the state related to the expansion of the marijuana sector. The additional revenue primarily funds education and the general fund. To put those revenue amounts in perspective, in total, the Colorado Department of Education received $90.3 million in marijuana tax revenue for the 2017-18 school year, or 1.6 percent of the state’s total K-12 education budget.xxii Revenues from the special sales tax on recreational marijuana have totaled about $108.4 million to date in fiscal 2018. Starting next year, the general fund will receive 15.56 percent of those revenues, which if applied this year would have equaled about 0.2 percent of general fund revenues to date in fiscal 2018.xxiii, xxiv
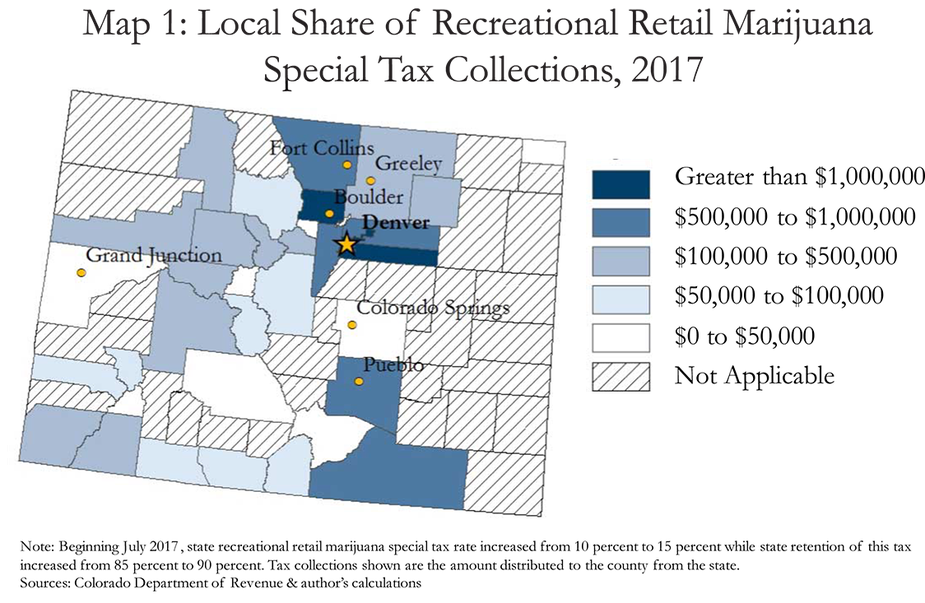
As noted above, local jurisdictions receive 10 percent of special sales tax collections on recreational marijuana that is collected by the state. Map 1 shows the amount that each county received from the state in 2017, which is based on where the sales occurred. These numbers do not reflect local sales tax collections. In addition to conveying tax distributions to each county, these data reflect sales patterns across Colorado. Marijuana sales are heavily concentrated along the Front Range of Denver. In January 2018, the counties with the largest share of total recreational retail marijuana sales were Denver, Arapahoe, Boulder and Adams counties with 32.5 percent, 10.2 percent, 7.0 percent and 6.9 percent, respectively.xxv
Potential Costs of Marijuana Legalization
This article focused on the economic effects of legalization using available tax and licensing data. However, there also are costs to the state related to public safety and health care, areas where data do not exist to show to what extent economic benefits have offsetting costs. One source, a March 2016 report by the Colorado Department of Public Safety, provides some early statistics related to the effects of marijuana legalization on public safety and public health. Reported marijuana usage has increased significantly in the state, with the percentage of 18 to 25 year olds reporting usage over the past month increasing from 21 percent in 2006 to 31 percent in 2014. Similarly, reported usage among adults over 25 has risen from 5 percent in 2006 to 12 percent in 2014. Hospitalizations related to marijuana also rose sharply from 803 per 100,000 hospitalization on average between 2001 and 2009 to 2,413 per 100,000 between 2014 and mid-2015. In addition, calls to poison control mentioning marijuana have increased between 2006 and 2015.xxvi
The data on legalization’s impact on public safety is limited, and therefore, the full effects of legalization on public safety are uncertain. Between 2012 and 2014, the number of marijuana arrests fell 46 percent, primarily due to a decline in marijuana possession arrests.xxvii In Denver, the number of crimes reported to the Denver Police Department that were determined to have a clear connection to marijuana increased from 234 in 2013 to 276 in 2014, but then fell to 183 in 2017. Of the crimes reported with a connection to marijuana in 2017, 54 percent were burglaries and 74 percent were industry-related.xxviii Fifteen percent of DUI summons issued by the Colorado State Patrol in 2015 were for marijuana or marijuana in combination with alcohol or other drugs although the number of these types of DUIs fell 1 percent between 2014 and 2015. Traffic fatalities with THC-only or THC-in-combination positive drivers rose from 55 in 2013 to 79 in 2014.xxix
In addition to the potential costs related to public safety and health care, Colorado’s legalization of marijuana conflicts with federal law, which has created other challenges including access to the payment and banking systems, legal risks for business owners and consumers and the diversion of marijuana purchased in Colorado to other states where marijuana remains illegal under state law.
Conclusion
As the first state to open recreational marijuana retail stores, Colorado provides a case study to examine the potential economic effects from legalization. Direct employment in the marijuana sector has risen robustly since the passage of Amendment 64, contributing about 5.4 percent of all employment growth in Colorado since January 2014.xxx Despite these solid gains, employment in the sector makes up just 0.7 percent of total employment in the state. Similar to employment, tax collections from marijuana have also increased sharply in recent years, and are equal to about 2 percent of general fund revenues in the state. Although legalization has contributed to employment growth and tax revenues in the state, it is important to weigh those benefits against the potential costs to public safety and health outcomes.
End notes
i. Sanders, Linley. “Marijuana Legalization 2018: Which States Might Consider Cannabis Laws This Year?” Newsweek, Jan. 2, 2018.
ii. Colorado Marijuana Enforcement Division, Hartman et al. “MED 2017 Mid-Year Update.” MED 2017 Mid-Year Update, pp. 1–12. www.colorado.gov/pacific/enforcement/med-updates.
iii. Despite a large increase in recreational marijuana sales, medical sales have not declined. There are some differences between recreational and medical marijuana in Colorado, primarily that you must possess a prescription to purchase medical marijuana whereas recreational marijuana can be purchased by anyone over the age of 21. In addition, the tax rate on medical marijuana is significantly lower than the tax on recreational marijuana. Although the legal potency of marijuana flowers is similar across medical and recreational, THC levels in medical edible products can be higher. Also, Colorado law allows individuals to possess 1 ounce of recreational marijuana or 2 ounces of medical marijuana with a prescription. Specific code and regulation of recreational and medical marijuana can be found from the State of Colorado at: https://www.colorado.gov/pacific/sites/default/files/MEDICAL-FinalApprovedPermanentRules.pdf and https://www.colorado.gov/pacific/sites/default/files/Amalgamated%20Retail%20Marijuana%20Rules%2001012018.pdf
iv. Colorado Department of Revenue, Office of Research and Analysis. “Marijuana Sales Reports.” www.colorado.gov/pacific/revenue/colorado-marijuana-sales-reports
v. Bureau of Economic Analysis, Gross State Product. https://www.bea.gov/regional/index.htm
vi. Colorado Department of Revenue, Office of Research and Analysis. “Marijuana Sales Reports.” www.colorado.gov/pacific/revenue/colorado-marijuana-sales-reports
vii. Colorado Department of Revenue – Enforcement Division
viii. CBRE, Vance, Matt, and Katie Murtaugh. Three Years After Legalization-Marijuana Real Estate in Denver. pp. 1–10, Three Years After Legalization-Marijuana Real Estate in Denver.
ix. Storum, Doug. “Pot Industry Driving up Rates for Industrial Space.” BizWest, June 6, 2017, bizwest.com/2017/06/06/report-pot-industry-driving-rates-industrial-space/.
x. Colorado Department of Revenue – Enforcement Division, MED Occupational Licensing. https://www.colorado.gov/pacific/enforcement/med-occupational-licensing
xi. According to their website, “The Marijuana Policy Group, LLC (MPG) was formed in 2014 as a collaborative effort between researchers from the University of Colorado Boulder Business Research Division and BBC Research & Consulting in Denver. Researchers from these entities have offered custom economic, market, financial and policy research and consulting services for over 40 years. The MPG is a separate, non-affiliated entity dedicated to new market policy and analysis. The MPG mission is to apply research methods rooted in economic theory and statistical applications to inform regulatory policy decisions in the rapidly growing legal medical and recreational marijuana markets.”
xii. Marijuana Policy Group, Light et al. The Economic Impact of Marijuana Legalization in Colorado. October 2016.
xiii. Ibid.
xiv. Colorado Department of Revenue, Office of Research and Analysis. “Marijuana Tax Data.” https://www.colorado.gov/pacific/revenue/colorado-marijuana-tax-data
xv. Tax Foundation, Henchman, Joseph. “Taxing Marijuana: The Washington and Colorado Experience.” August 2014.
xvi. Colorado Department of Revenue, Office of Research and Analysis. “Marijuana Tax Data.” https://www.colorado.gov/pacific/revenue/colorado-marijuana-tax-data
xvii. Ibid.
xviii. Colorado Department of Revenue, Office of Research and Analysis. “General Fund Net Tax Collections – February 2018.” https://www.colorado.gov/pacific/revenue/general-fund-net-tax-collections
xix. For fiscal year 2018, the other 90 percent is split between the state public school fund ($30 million in fiscal 2018), the state’s general fund (28.15 percent of the state’s share minus $30 million) and the marijuana tax cash fund (71.85 percent of the state’s share). (State of Colorado, Joint Budget Committee. Appropriations Report Fiscal Year 2017-2018.)
xx. State of Colorado, Joint Budget Committee. Appropriations Report Fiscal Year 2017-18.
xxi. “Marijuana Tax Revenue and Education FAQ.” Colorado Department of Education, Sept. 21, 2017, www.cde.state.co.us/communications/20170919mjqanda.
xxii. Ibid.
xxiii. Colorado Department of Revenue, Office of Research and Analysis. “Marijuana Taxes, License, and Fee Revenue February 2014 to Date.” https://www.colorado.gov/pacific/revenue/colorado-marijuana-tax-data
xxiv. Colorado Department of Revenue, Office of Research and Analysis. “General Fund Net Tax Collections – February 2018.” https://www.colorado.gov/pacific/revenue/general-fund-net-tax-collections
xxv. Colorado Department of Revenue, Office of Research and Analysis. “Marijuana Sales Reports.” www.colorado.gov/pacific/revenue/colorado-marijuana-sales-reports
xxvi. Colorado Department of Public Safety, Division of Criminal Justice. “Marijuana Legalization in Colorado: Early Findings.” http://cdpsdocs.state.co.us/ors/docs/reports/2016-SB13-283-Rpt.pdf
xxvii. Ibid.
xxviii. City of Denver Open Data Catalog, “Crime Marijuana – Comma-Separated Values.” https://www.denvergov.org/opendata/dataset/city-and-county-of-denver-crime-marijuana
xxix. Colorado Department of Public Safety, Division of Criminal Justice. “Marijuana Legalization in Colorado: Early Findings.” http://cdpsdocs.state.co.us/ors/docs/reports/2016-SB13-283-Rpt.pdf
xxx. Assuming that full-time employment in the marijuana industry equals 0.467 times the number of active occupational licenses, the change in employment in the marijuana industry between January 2014 and February 2018 equates to 5.4 percent of the total change in Colorado’s nonfarm employment during that time. Data do not exist for the number of occupational licenses in December 2013. If we assume that the number of licenses in January 2014 were all new jobs, the change in employment in the marijuana industry between December 2013 and February 2018 would represent 7.4 percent of the change in total nonfarm employment.