In times of economic stress, the federal government often steps in to support the U.S. economy. When unemployment rates are high, federal government outlays rise due to increased spending on social programs and stimulus measures. These higher outlays boost the economy at a time when incomes (and therefore tax revenues) are weaker, but also raise the federal government deficit. When unemployment returns to healthier levels, revenues rise and the government tends to scale back stimulus measures, lowering the federal deficit. In this way, the unemployment rate and federal deficit have often moved together.
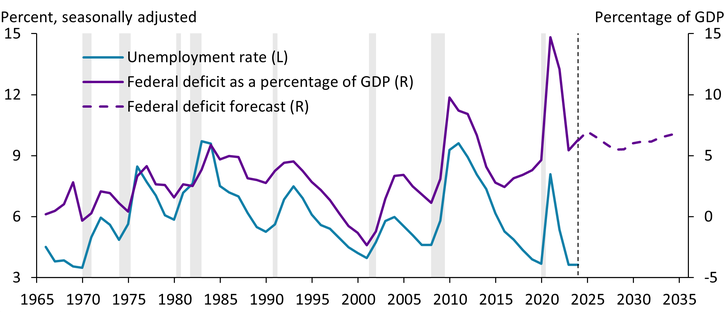
However, this pattern appears to have changed more recently. Chart 1 shows that the unemployment rate (blue line) and the federal deficit (purple line) indeed moved together between 1965 and 2007. After the 2007–09 financial crisis, however, the deficit remained elevated even when unemployment rates normalized. Moreover, during the recovery from the COVID-19 pandemic, federal outlays and deficits remained higher than their pre-pandemic levels even after the unemployment rate had fully recovered.
Chart 1: Historically, federal deficits have moved closely with the unemployment rate

Notes: Gray bars denote National Bureau of Economic Research (NBER)-defined recessions. The deficit reflects the Congressional Budget Office’s (CBO) baseline total deficit adjusted to exclude the effects of timing shifts. The forecast is from June 2024.
Sources: U.S. Bureau of Labor Statistics (BLS) and NBER (both accessed via Haver Analytics); CBO.
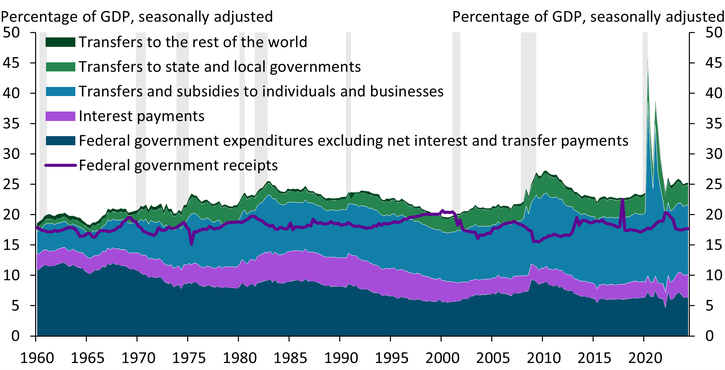
This shift toward more sustained government spending during recoveries has been driven by higher transfers. Chart 2 shows that transfers have made up a rising share of federal outlays and GDP over time._ In 1960, federal spending excluding transfers and net interest payments (dark blue area) accounted for about 11.0 percent of GDP, while transfers and subsidies to individuals and businesses (light blue area) accounted for 3.7 percent and transfers to state and local governments (light green area) added another 0.7 percent. By the first half of 2024, federal spending had declined to less than 6.5 percent of GDP, but transfers and subsidies to individuals and businesses had risen to more than 11.0 percent of GDP, while transfers to state and local governments made up another 3.3 percent of GDP. Over the years, net interest payments have varied with the level of government debt as well as interest rates. On the other hand, federal revenues have not kept pace with this rise in outlays; federal government receipts were 17.6 percent of GDP in 1960 (purple line) and remained at a similar ratio in 2024. As a result, federal deficits have risen from an average of 2.2 percent of GDP over 1965–2006 to an average of 5.9 percent since 2007.
Chart 2: Transfers have increased as a share of federal outlays over time

Notes: Chart depicts quarterly data. Gray bars denote NBER-defined recessions.
Sources: U.S. Bureau of Economic Analysis (BEA) and NBER (both accessed via Haver Analytics).
Government transfers to individuals cover a variety of healthcare and social programs. Outside of recessions, social security and Medicare payments have been major contributors to rising transfers to individuals. Other typical forms of transfers to individuals include Medicaid, supplemental security income, earned income tax credits, supplemental nutrition assistance payments, and veterans’ benefits.
During the COVID-19 pandemic, these transfers became particularly important. As unemployment rates surged, the federal government rolled out unprecedented relief programs, with much of the increase in federal outlays in the form of transfers and subsidies to individuals and businesses. In addition to traditional forms of transfers, the federal government distributed stimulus payments, expanded unemployment programs, and provided Paycheck Protection Program loans to businesses and nonprofits.
Although federal spending outside of transfers was largely unchanged during the pandemic, transfers to individuals and state and local governments surged in 2020 and remain higher than pre-pandemic levels in the first half of 2024 (the most recent data available). Transfers to individuals rose from 13 percent of GDP in the second half of 2019 to more than 27 percent in mid-2020 and early 2021, when stimulus packages were distributed. Transfers and subsidies to individuals and businesses remain 1.4 percent of GDP higher in the first half of 2024 than pre-pandemic. Similarly, transfers to state and local governments increased from 2.8 percent of GDP in late 2019 to about 7.0 percent of GDP during peak stimulus distribution quarters and remain 0.45 percent above their pre-pandemic share. These higher transfers have supported consumer spending, business fixed investment, and state and local spending in recent years.
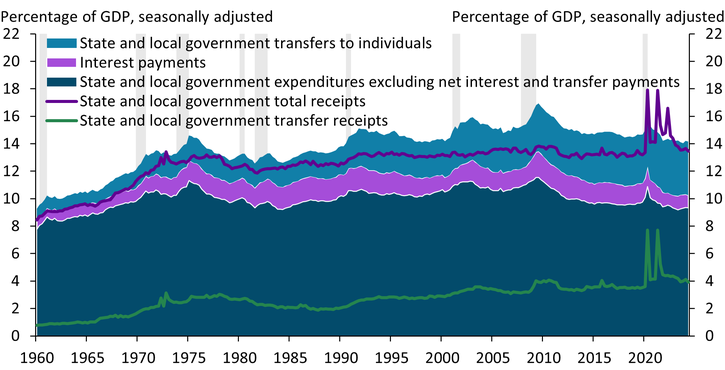
As state and local governments have received higher transfers from the federal government, they have also increased their transfers to individuals, a long-term trend that accelerated briefly during the pandemic._ Chart 3 shows that state and local government transfer receipts (green line)—most of which come from the federal government—have increased from less than 0.8 percent of GDP in 1960 to about 4.0 percent in the first half of 2024. Accordingly, transfers from state and local government to individuals (light blue area) rose from about 0.8 percent of GDP in 1960 to 4.0 percent in 2024. These transfers to individuals include some joint programs with the federal government—such as Medicaid, unemployment insurance, and Temporary Assistance for Needy Families (TANF)—as well as state and local programs for income assistance, housing, and education.
Chart 3: Larger transfer receipts boosted state and local government transfers to individuals

Notes: Chart depicts quarterly data. Gray bars denote NBER-defined recessions.
Sources: BEA and NBER (Haver Analytics).
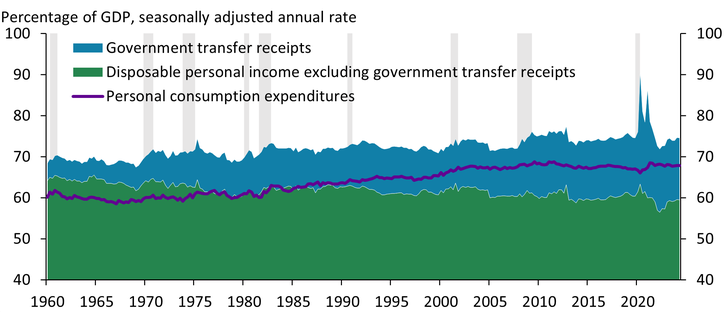
The rise in transfers from federal, state, and local governments has boosted personal incomes and supported higher consumer spending._ Chart 4 shows that as a share of GDP, disposable personal income excluding government transfers (green area) has declined by more than 5 percent since 1960, falling below 60 percent of GDP by 2024. During the same period, transfers individuals received from federal, state, and local governments increased from about 4.5 percent of GDP to 15.0 percent (light blue area). Notably, personal consumption expenditures surpassed disposable income excluding transfers in the late 1980s. After the pandemic, the surge in government transfers helped support a rise in personal consumption expenditures from 67.0 percent of GDP in the second half of 2019 to 67.8 percent in the first half of 2024 (purple line).
Chart 4: Government transfers have made up a greater share of disposable personal income over time

Notes: Chart depicts quarterly data. Green area shows disposable personal income excluding transfers net of any income taxes paid, including taxes on income from government transfers. To ensure shaded areas sum to total disposable personal income as a share of GDP, our measure of government transfers (blue area) does not remove these tax payments a second time. Gray bars denote NBER-defined recessions.
Sources: BEA and NBER (Haver Analytics).
An increasing share of federal government outlays has shifted to individuals in the form of transfers over time. This trend was particularly notable during the years following the onset of the pandemic, when robust federal transfers supported higher levels of consumer spending and increased deficits even as unemployment returned to pre-pandemic rates. Understanding the full effect of federal government outlays requires examining not only federal spending but also how transfers affect individuals and state and local governments.
Endnotes
-
1
Federal outlays include consumption expenditures, transfer payments, interest payments, subsidies, gross government investment, and capital transfer payments less the consumption of fixed capital.
-
2
According to the National Association of State Budget Officers, in addition to increasing transfers to individuals, state governments also increased their total balances from $121.6 billion in fiscal year 2019 to $428 billion in fiscal year 2023. At the same time, 31 states adopted net decreases in taxes and fees for fiscal year 2023, and 37 states adopted tax cuts for fiscal year 2024.
-
3
Consumer spending was also supported by higher levels of saving during pandemic-related shutdowns and strong employment and income growth in the following years.
Huixin Bi is a research and policy officer at the Federal Reserve Bank of Kansas City. Alison Felix is a senior policy advisor at the bank. The views expressed are those of the authors and do not necessarily reflect the positions of the Federal Reserve Bank of Kansas City or the Federal Reserve System.
