Housing accounts for roughly one-third of the average American’s spending, making higher housing costs a potential strain on household budgets. Over the last five years, rapidly rising home prices and higher financing costs have outpaced wage gains in most counties in the United States, making new homeownership less affordable in many regions across the country.
For first-time homeowners, the average share of household income needed to purchase and finance a median-priced home in a given county has risen throughout most of the United States._ Map 1 shows the share of income that a household earning the average wage in a particular county would need to own a median-priced home in that county in 2018–19 (Panel A) and in 2024 (Panel B). Counties shaded in blue are considered unaffordable in that average wage earners in these counties spend 33 percent or more of their monthly income on homeownership costs._
Map 1: First-time homeownership has become less affordable across much of the United States
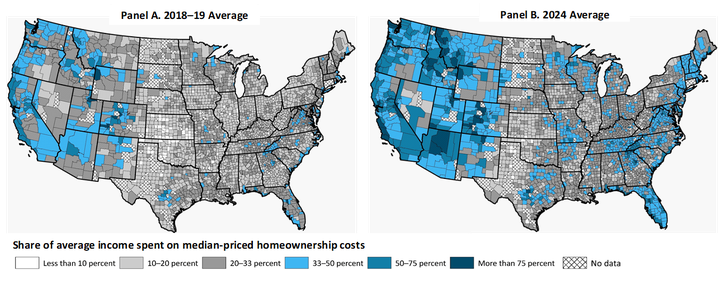
Notes: We estimate the share of income for homeownership as total homeownership costs divided by household income, where ownership costs are equal to annual mortgage payments for the median home value in a county (calculated assuming a 20 percent down payment and a fully amortizing 30-year mortgage at the national average rate) plus 3 percent of the median house price to account for expenses such as taxes, insurance, and maintenance (Rappaport 2023, 2024). Annual household income is calculated by multiplying average county weekly wages over a year by a weighted average of earners per household. We use weekly average wages due to timeliness, as county-level median household income is only available with a one-year lag.
Sources: Zillow, U.S. Bureau of Labor Statistics (BLS), U.S. Census Bureau (IPUMS NHGIS), Wall Street Journal (Haver Analytics), and authors’ calculations.
From 2018–19 to 2024, the share of income needed to own a median-priced home rose in most U.S. counties, evidenced by the drastic shift from mostly “affordable” counties (white and gray) to “unaffordable” counties (blue and dark blue) during this period. The decline in new home affordability for the average household was most pronounced in the western United States, coastal markets, and parts of the southeast. However, even counties in the central United States—for example, in Missouri, Texas, and Minnesota—experienced declines in affordability.
Housing affordability for first-time homebuyers began to worsen in 2022. Chart 1 shows the share of income required for a first-time homebuyer to own a median-priced home as a distribution of U.S. counties from 2018 to 2024. In 2018, the share of income needed to purchase a new home in the median county was roughly 20 percent, and the median-priced home was considered unaffordable in only 12 percent of counties. By 2024, the share of income needed to purchase a new home rose to 28 percent in the median county, and the median-priced home was considered unaffordable in 37 percent of U.S. counties.
Chart 1: New homeownership is now unaffordable for many U.S. counties
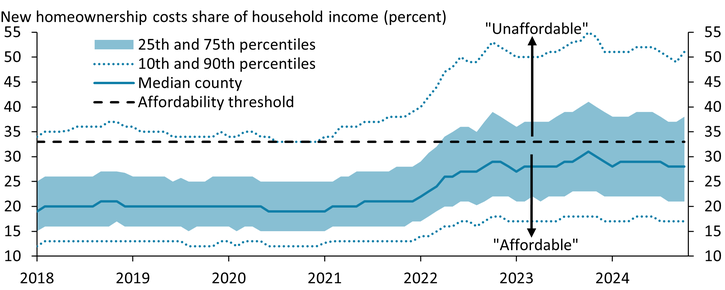
Notes: New homeownership costs as a share of household income estimated using the same methodology as in Map 1. The denominator is the 12-month moving average of household income as calculated in Map 1. Dotted line shows threshold for new homeownership affordability at 33 percent. Distribution estimated using a balanced panel of 2,938 counties across the United States for which Zillow median house price and income data are available throughout the entire period.
Sources: Zillow, BLS, U.S. Census Bureau (IPUMS NHGIS), Wall Street Journal (Haver Analytics), and authors’ calculations.
The share of household income needed for a first-time homebuyer to own a home has risen in recent years due to both rising house prices and higher borrowing costs. In late 2020, house prices in most locations accelerated as the pandemic pushed many renters and roommates to seek out more space, thereby increasing the demand for housing (Gamber, Graham, and Yadav 2023). Chart 2 shows that while average household income (green line) rose during this period, higher incomes were not enough to offset higher house prices (blue line) in most counties. In 2022, higher borrowing rates (purple line) began exacerbating affordability issues across the United States, making homes in many counties unaffordable for the average household. Borrowing rates have leveled off, wages have continued to rise steadily, and the pace of house price increases decelerated in 2023 and 2024, but new homeownership remains costly across large portions of the country.
Chart 2: Higher home prices and elevated borrowing costs outpaced wage increases, making home ownership less affordable
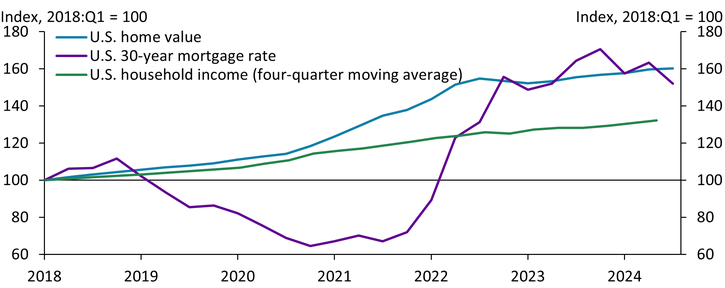
Note: U.S. household income is calculated using the same methodology as in Map 1.
Sources: Zillow, BLS, Wall Street Journal (Haver Analytics), and authors’ calculations.
Although rising homeownership costs for first-time buyers have been broad-based, they have been greater in metro areas than nonmetro areas. Chart 3 shows that new homeownership has become less affordable across both metro and nonmetro counties. However, the gap in affordability between metro and nonmetro areas has widened since the pandemic. The median share of average household income spent on homes in metro counties grew from 23 percent in 2018–19 to 33 percent in 2024. The same share for nonmetro (rural) counties rose from 19 percent to only 26 percent over the same period. In 2024, nonmetro counties remain relatively more affordable, with roughly two-thirds of nonmetro counties designated as affordable compared with only one-half of metro counties.
Chart 3: Rise in homeownership costs were felt across metro and nonmetro locations
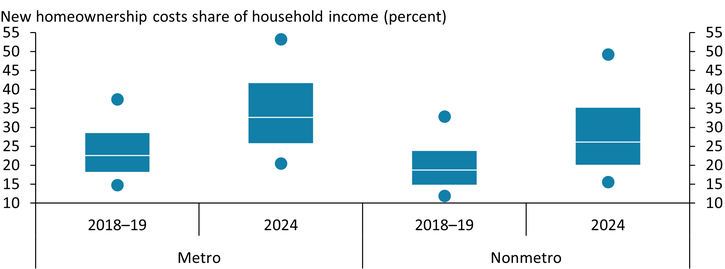
Notes: New homeownership costs as a share of household income are estimated using the same methodology as in Map 1. Box and whisker plots denote the distribution of county level home affordability (dots are 10th and 90th percentiles, lower and upper box are 25th and 75th, and line is median). Metro counties are defined by the External LinkOffice of Management and Budget. These areas have a population of at least 50,000 or are economically integrated with larger counties, measured by commuting ties. Remaining counties are classified as nonmetro.
Sources: Zillow, BLS, U.S. Census Bureau (IPUMS NHGIS), Wall Street Journal (Haver Analytics), and authors’ calculations.
Overall, housing costs remain high for new home buyers, and affordability has worsened over the last five years. Higher house prices and borrowing costs have not been offset by higher wages, causing affordability issues for new homeowners across a majority of the United States. These affordability issues are broad-based across metro and nonmetro counties, but housing costs increased more relative to incomes in metro counties. While new homeownership costs are high, some reprieve may be ahead. Wages have continued to rise steadily and house price gains are slowing. Nonetheless, it may still take time for housing affordability to return to historical norms.
Endnotes
-
1
We call this the ratio for first-time homebuyers because new buyers do not have any transferrable equity from the sale of a previous home. Our affordability measure assumes those buyers have saved enough for a 20 percent down payment.
-
2
Homeownership costs and long-term debt greater than 33 percent of gross income is generally considered “unaffordable” (FDIC). This 33 percent share of gross income is an important consideration in housing markets, as lenders are reluctant to make loans that exceed this share of income.
References
FDIC (Federal Deposit Insurance Corporation). n.d. “External LinkLoans and Mortgages: How Much Mortgage Can I Afford?”
Gamber, William, James Graham, Anirudh Yadav. 2023. “External LinkStuck at Home: Housing Demand during the COVID-19 Pandemic.” Journal of Housing Economics, vol. 59, part B, March.
Rappaport, Jordan. 2024. “External LinkHousing Services Inflation May Decline Only Gradually.” Federal Reserve Bank of Kansas City, Economic Bulletin, June 24.
———. 2023. “External LinkHome Prices Are Overvalued but Will Decline Only Gradually.” Federal Reserve Bank of Kansas City, Economic Bulletin, February 17.
John McCoy is an associate economist and David Rodziewicz is an advanced economics specialist at the Federal Reserve Bank of Kansas City. Chase Farha is a research associate at the bank. The views expressed are those of the authors and do not necessarily reflect the positions of the Federal Reserve Bank of Kansas City or the Federal Reserve System.