Central banks around the world have moved toward monetary policy frameworks that employ inflation-targeting—that is, communicating an objective for inflation, then setting policy to achieve that objective. Through inflation-targeting, policymakers hope to increase transparency around their actions and keep inflation expectations anchored. In the United States, the Federal Reserve communicates its inflation objective in terms of the Personal Consumption Expenditures (PCE) price deflator, which is the price of all final goods in the economy.
Although the Federal Reserve’s inflation objective is for overall, or headline, inflation, public communications often refer to core inflation, which excludes prices for food at home and energy. Policymakers have used this measure of core inflation since the 1970s, as historically, food and energy prices have been susceptible to large, temporary price changes that are unlikely to be related to underlying trend inflation._ However, communicating about core inflation can be challenging for central banks, as food prices are particularly salient to consumers. As several decades have passed since the Fed began using core inflation in its communications, are the reasons for excluding food prices still relevant?
Chart 1 shows that while food-at-home inflation was more volatile in the 1970s and 1980s, in recent years, food-at-home inflation has been less volatile than energy inflation and no more volatile than many nondurable goods included in core inflation._ Between 1970 and 1989, food-at-home inflation averaged about 6 percent annually (blue bar) and varied widely around this average by around 4 percentage points (purple bar). Nondurable goods inflation was similarly high but less volatile, varying by 3 percentage points around its average. Energy inflation was higher and more volatile than the other two categories, averaging over 7 percent and fluctuating 11 percentage points around this average. Since 1990, however, inflation and volatility have declined for both food and nondurable goods. Between 1990 and 2019, food-at-home inflation averaged around 2 percent and varied by 2 percentage points around this average. Nondurable goods inflation averaged near zero but also varied by 2 percentage points around this average. Although energy inflation also fell during this period to an average of 3 percent, its variability stayed high at 11 percentage points. Overall, the chart shows that the volatility of food-at-home inflation has fallen relative to nondurable goods and energy and now appears to be only as volatile as the key components of core inflation.
Chart 1: Food-at-home inflation has been as volatile as other components included in core inflation since 1990
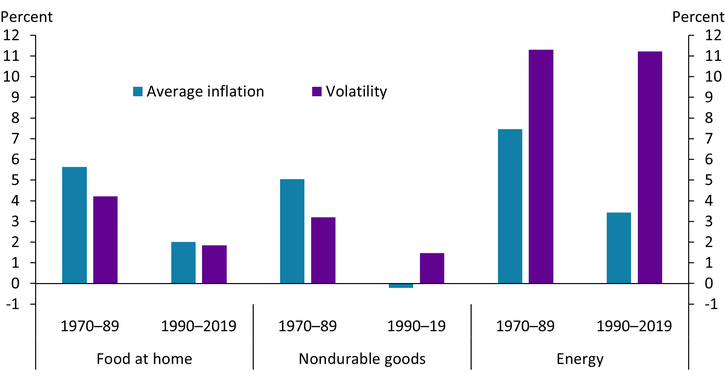
Notes: Nondurable goods include cleaning and personal care products and recreational goods such as games and hobby products. We end our sample in 2019 to avoid pandemic effects, though including the pandemic period leads to qualitatively similar conclusions.
Sources: U.S. Bureau of Economic Analysis (Haver Analytics) and authors’ calculations.
Even with this decline in volatility, policymakers may still not wish to include food-at-home inflation in core inflation if movements in food prices are driven by temporary changes in agricultural commodity prices due to weather events (such as drought or flooding) instead of factors affecting the broader economy. Indeed, some evidence suggests that these types of events affected food prices and inflation in the 1970s (Blinder 1982). However, the effect of commodity prices on retail food prices has declined in recent decades as the food industry has evolved. Chart 2 shows that for each dollar consumers spent on food over the 2000–23 period, almost 30 cents can be attributed to the packing and processing industry, and more than 40 cents can be attributed to transportation, wholesale, and retail trade. Only 15 cents can be attributed to farm production and agribusiness, which are activities more tied to agricultural commodity prices. Moreover, Scott, Cowley, and Kreitman (2023) argue that food-at-home inflation during the pandemic was largely driven by labor constraints, while Scott and others (2024) show that the agricultural commodity prices passthrough to food-at-home prices is small, likely because these changes are absorbed by firms along the supply chain._ In other words, food prices today are less affected by factors particular to the agriculture industry than in past decades, suggesting that this reason for excluding food at home from core inflation has become less salient.
Chart 2: Farm production consists of a small share of the cost for food at home
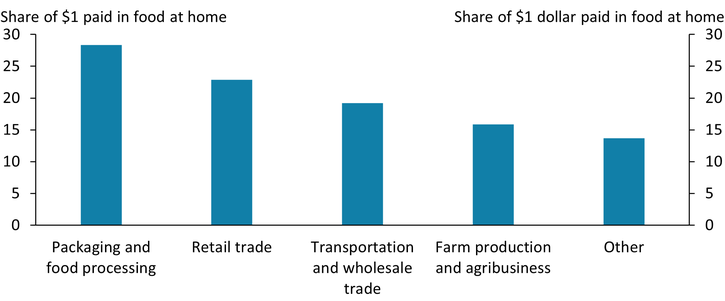
Note: Chart depicts the average of each category using data from 2000 to 2023.
Source: USDA.
Additionally, we find little evidence that including food-at-home prices in measures of core inflation reduces its ability to predict future headline inflation. Chart 3 presents rolling-window forecasts using either core inflation or core inflation plus food-at-home inflation to predict headline inflation three months in the future. Both lines overlap for most of the sample period, highlighting that neither performs consistently better than the other in forecasting headline inflation. This pattern holds when we forecast over longer horizons (for example, six to 12 months ahead), suggesting the core + food inflation measure is suitable for near- and medium-term inflation forecasting. These results are consistent with prior evidence that excluding only energy from measures of inflation is sufficient to adequately forecast future headline inflation._
Chart 3: Forecasts of headline inflation using core inflation and core plus food-at-home inflation look remarkably similar
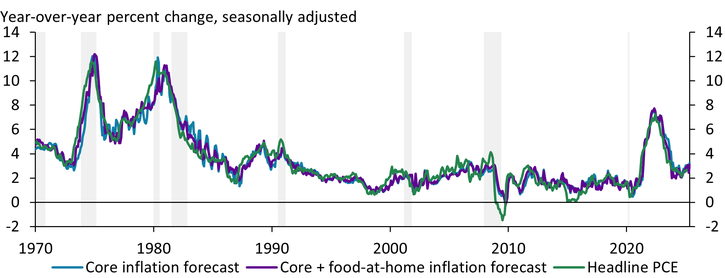
Note: Chart depicts three-month-ahead forecasts. Gray bars indicate National Bureau of Economic Research (NBER)-defined recessions.
Sources: U.S. Bureau of Economic Analysis and NBER (both accessed via Haver Analytics); authors’ calculations.
Overall, many of the drawbacks of including food inflation in measures of core inflation appear to have diminished since the 1970s. Food-at-home inflation is now no more volatile than many subcomponents of core inflation and increasingly responds to the same factors that affect the prices of other items included in core inflation. Most crucially, measures of inflation that incorporate food-at-home inflation perform just as well as traditional measures of core inflation in forecasting headline inflation. Including measures of food-at-home inflation in core inflation may therefore help policymakers better assess the underlying inflationary forces in the economy without omitting prices that are particularly salient to consumers.
Download Materials
Endnotes
-
1
The Federal Reserve Board staff has produced a staff forecast document since June 1964. From the start, staff provided a separate discussion of food price inflation and included a decomposition of inflation into food, goods excluding food, and services. In February 1975, the staff forecast started to regularly report a measure of inflation excluding food and energy prices.
-
2
We construct a measure of nondurable goods so that by the early 2020s, its expenditure share is similar to food at home, making them comparable for our analysis.
-
3
Disruptions that severely constrain the availability of agricultural products tend to increase food-at-home prices, particularly for products whose degree of processing is very low, like eggs. However, products that require a high degree of processing, like beef, can experience extended periods of supply constraints without any significant passthrough to food-at-home prices. For example, inventories of cattle have been low for the last three years, and although beef prices have put some upward pressure on inflation for meats, overall food inflation has not moved much.
-
4
See, for example, Clark (2001), Detmeister (2011), and McCracken and Ngân (2023).
References
Blinder, Alan S. 1982. “External LinkThe Anatomy of Double-Digit Inflation in the 1970s,” in Robert E. Hall, ed., Inflation: Causes and Effects, University of Chicago Press, pp. 261–282.
Clark, Todd E. 2001. “Comparing Measures of Core Inflation.” Federal Reserve Bank of Kansas City, Economic Review, vol. 86, no. 2, pp. 5–31.
Detmeister, Alan K. 2011. “External LinkThe Usefulness of Core PCE Inflation Measures.” Board of Governors of the Federal Reserve System, Finance and Economics Discussion Series, no. 2011-56.
McCracken, Michael W., and Trần Khánh Ngân. 2023. “External LinkUsing Core Inflation to Predict Headline Inflation.” Federal Reserve Bank of St. Louis, On the Economy, November 28.
Scott, Francisco, Amaze Lusompa, David Rodziewicz, Cortney Cowley, and Jacob Dice. 2024. “The Passthrough of Agricultural Commodity Prices to Food Prices.” Federal Reserve Bank of Kansas City, Research Working Paper no. 24-16, December.
Scott, Francisco, Cortney Cowley, and Ty Kreitman. 2023. “Tight Labor Markets Have Been a Key Contributor to High Food Inflation.” Federal Reserve Bank of Kansas City, Economic Bulletin, April 19.
Francisco Scott is an economist at the Federal Reserve Bank of Kansas City. José Mustre-del-Río is an assistant vice president and economist at the bank. Amaze Lusompa is an economist at the bank. Jalen Nichols is a research associate at the bank. The views expressed are those of the authors and do not necessarily reflect the positions of the Federal Reserve Bank of Kansas City or the Federal Reserve System.