Knowing how many jobs the U.S. economy has added each month is key for gauging the health of the labor market. However, the real-time accuracy of payroll data appears to have diminished since the pandemic. From 2000 to 2019, the first and third estimate of monthly payrolls differed by an absolute average of about 40,000 jobs. From March 2020 to December 2024, however, this difference grew to roughly 90,000 jobs.
Payroll data may have become more susceptible to mismeasurement since the pandemic for several reasons. For example, survey response rates have declined significantly since 2020, which may affect the representativeness of the sample. Further, official payroll statistics (specifically, the Current Establishment Survey, or CES) depend on a real-time assessment of the establishment landscape; however, assessing the number of new and dying firms that are not included in the survey of establishments has become more difficult given the surge in new business formation during and after the pandemic._
One way to sift out noise in payroll data is to estimate payrolls using the Kansas City Fed’s Labor Market Conditions Indicators (LMCI). Because the LMCI summarize 24 different labor market variables, they are less likely to be subject to the same measurement errors as payroll data alone (see Stock and Watson 2016)._ Moreover, they are likely to be more consistent with economic signals from the rest of the labor market.
To construct our LMCI-implied measure of payrolls, we first estimate the relationship between payroll data and the LMCI from 1992—when the LMCI first began—to 2019. We then use this relationship to create LMCI-implied payroll predictions. Because the relationship is estimated purely on pre-pandemic data, its post-pandemic predictions should not be affected by any post-pandemic noise in official payroll data.
However, even pre-pandemic relationships are noisy, because response rates for official surveys had been declining prior to the pandemic. We partially address this concern by dropping all official data from the construction of the LMCI and instead estimating the relationship between this alternative LMCI (excluding official data) and payrolls, again only using pre-pandemic data._ Predictions from this relationship are not only purely based on pre-pandemic data but are also more likely to avoid any potential pre-pandemic measurement error from official data.
Chart 1 shows that both LMCI-implied measures of payroll (including and excluding official data) are smoother than official estimates, even before the pandemic. The blue line shows official data on payrolls from the U.S. Bureau of Labor Statistics (BLS), while the purple and green lines represent payroll data implied by the full LMCI or the LMCI excluding any official surveys, respectively. Both the purple and green lines track the blue line well but display fewer wiggles, suggesting they are less noisy than official data. However, starting in 2016, both LMCI-implied measures of payroll growth remain systematically above the official measure. This suggests that viewed through the lens of the LMCI, official payroll growth was lower than overall labor market conditions would imply. Consistently, this period had hallmarks of a strong labor market, such as rising labor force participation, quits, and wage growth. The difference between the LMCI-implied and official measures highlights the usefulness of the many data sources the LMCI summarizes.
Chart 1: LMCI-implied measures deliver smoother payroll predictions than official estimates
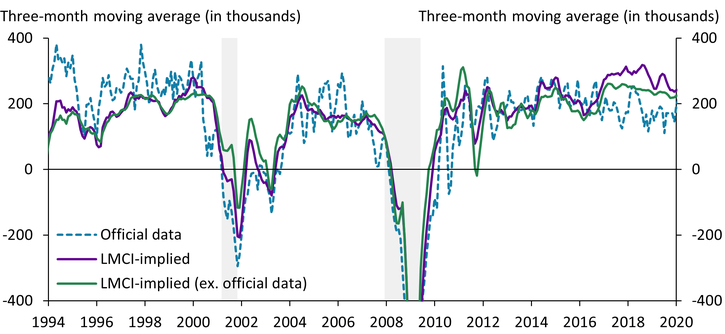
Notes: All series are three-month moving averages. Gray bars denote National Bureau of Economic Research (NBER)-defined recessions.
Sources: U.S. Bureau of Labor Statistics (Haver Analytics), NBER (Haver Analytics), Federal Reserve Bank of Kansas City, and authors’ calculations.
What do the LMCI-implied measures suggest more recently? Chart 2 reveals that both LMCI-implied measures of payrolls show more stable payroll growth in recent years than official data suggest. Indeed, while official data display a pronounced decline in payrolls from 2022 to the present, the LMCI-implied measures are comparatively flatter. Most notably, over the second half of 2024, the LMCI-implied measures suggest the three-month moving average of payroll growth has remained fairly steady at around 180,000 to 190,000 jobs per month. In contrast, the three-month moving average of official payroll growth has been much more volatile, though it is gradually converging to the LMCI-implied values. As of December 2024, the three-month moving average of official payrolls stands at 170,000, whereas the LMCI-implied measures suggest payrolls are closer to 200,000. In other words, our results suggest that, as of late, official payroll growth could be understated by 30,000 jobs per month.
Chart 2: LMCI-implied measures of payrolls suggest payroll growth has been stable
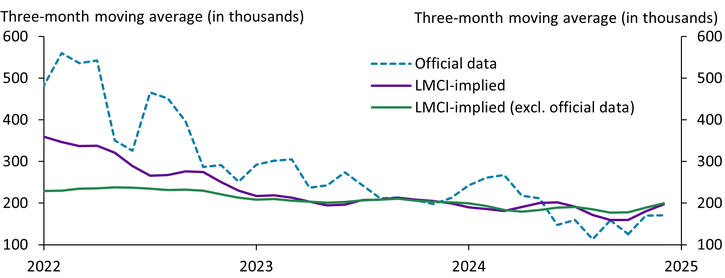
Note: Data are through December 2024.
Sources: U.S. Bureau of Labor Statistics (Haver Analytics), Federal Reserve Bank of Kansas City, and authors’ calculations.
In summary, the LMCI provides not only a holistic view of the labor market, but also a method for sifting out the noise from official data on payroll growth. LMCI-implied payroll estimates suggest the labor market may be a bit stronger than what official data indicate. Because the LMCI also delivers smoother estimates of payrolls from one month to the next, it may be useful for policymakers who wish to avoid overweighting any single reading when determining policy responses.
Endnotes
-
1
Data from the U.S. Bureau of Labor Statistics (BLS) suggests a secular decline in the CES response rate since at least 2014, with a large and persistent drop from 60 percent in January 2020 to 43 percent in June 2024. For more details, see the External LinkOffice of Survey Methods Research. Yeh (2025) documents a nearly 50 percent increase in new business applications (compared with 2019 levels) starting in the second half of 2020, which has persisted.
-
2
For example, Fernald, Hsu, and Spiegel (2019) follow a similar approach and create summary variables of Chinese imports using reported exports of trading partners to gauge the accuracy of official Chinese economic activity statistics. We use the LMCI to gauge the accuracy of official payroll data. As a robustness check, we remove payrolls when calculating the LMCI and find that our results are not sensitive to the exclusion.
-
3
Specifically, we exclude all data from the BLS (15 series) and unemployment insurance claims from the U.S. Department of Labor (one series).
References
Fernald, John G., Eric Hsu, and Mark M. Spiegel. 2021. “External LinkReprint: Is China Fudging Its GDP Figures? Evidence from Trading Partner Data.” Journal of International Money and Finance, vol.114, no. 102406.
Stock, James H., and Mark W. Watson. 2016. “External LinkDynamic Factor Models, Factor-Augmented Vector Autoregressions, and Structural Vector Autoregressions in Macroeconomics,” in John B. Taylor and Harald Ulhig, eds., Handbook of Macroeconomics, vol. 2, pp. 415–525.
Yeh, Chen. 2025. “External LinkWill the Pandemic Surge in Employer Business Formation Last?” Federal Reserve Bank of Richmond, Economic Brief, no. 25-01.
Amaze Lusompa is an economist at the Federal Reserve Bank of Kansas City. José Mustre-del-Río is an assistant vice president at the bank. The views expressed are those of the authors and do not necessarily reflect the positions of the Federal Reserve Bank of Kansas City or the Federal Reserve System.