Over the past two years, the U.S. labor market has cooled from very tight levels but remains healthy. However, aggregate figures may mask important differences across industries. To gain a more nuanced picture of the labor market, we use industry-level versions of the Kansas City Fed’s Labor Market Conditions Indicators (LMCI) to compare the performance of each industry’s labor market relative to its own long-run average (following Dilts Stedman and Pollard 2023). In particular, we examine industry-specific versions of the “level of activity” indicator, which measures the overall state of the labor market using information from 24 labor market series._
Chart 1 shows that the labor markets of most industries have followed a similar path to the labor market for the United States as a whole (black line). In all industries, labor market activity, as measured by the LMCI level of activity indicator, fell in 2020 at the start of the pandemic, then rallied, peaking in the first half of 2022. Since then, labor market activity in all industries has trended back toward long-run averages, and the magnitude of these changes has shown little variation across many industries. Nonetheless, some outliers have widened the spread in labor market activity readings since 2020.
Chart 1: The LMCI level of activity follows similar trends across industries
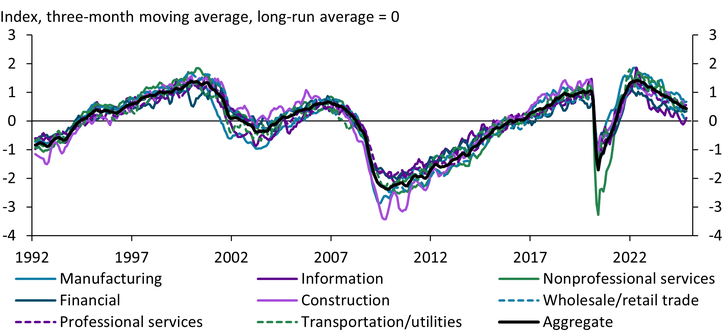
Notes: All series have an average of zero. The y-axis unit is standard deviations of the aggregate LMCI series. Sources for model input data can be found in the data appendix on the article’s webpage.
Sources: Federal Reserve Bank of Kansas City, Dilts Stedman and Pollard (2023), and authors’ calculations.
Chart 2 offers a closer look at these outliers by plotting the aggregate level of activity indicator (black line) alongside the industry-specific indicators for manufacturing (blue line), information (purple line), and nonprofessional services (green line). Labor market activity in the manufacturing industry recovered more quickly from the effects of the pandemic, peaking above the aggregate during 2022. While labor market activity in manufacturing has since declined, it remains above the aggregate series and well above its own long-run average, indicating continued tightness in this industry. Labor market activity in the information industry, which includes technology, telecommunications, and publishing firms, also peaked above the aggregate series during 2022. However, labor market activity declined steeply at the end of 2022, and the labor market in the information industry now appears weaker than the aggregate. In contrast, labor market activity in nonprofessional services, which includes leisure and hospitality, repair and maintenance, and personal care services, fell much further than in other industries during the pandemic lockdowns, creating the largest gap between an industry level of activity series and the aggregate in the history of the series. As lockdowns ended and demand for services returned, the labor market for nonprofessional services tightened, and more recently this industry has tracked the aggregate.
Chart 2: Some industries appear tighter or weaker than the aggregate labor market
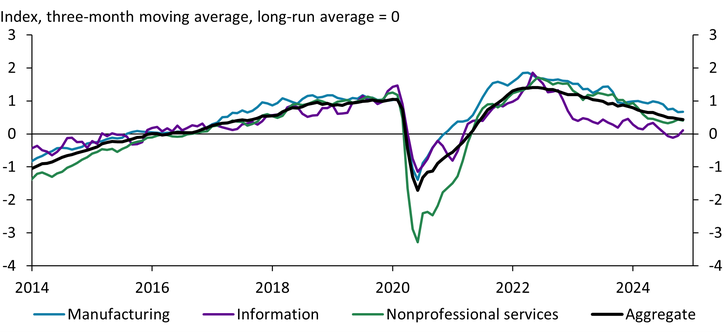
Notes: All series have a long-run average of zero. The y-axis unit is standard deviations of the aggregate LMCI series. Sources for model input data can be found in the data appendix on the article’s webpage.
Sources: Federal Reserve Bank of Kansas City, Dilts Stedman and Pollard (2023), and authors’ calculations.
The divergence between the level of activity in manufacturing, information, and the overall labor market is unusual. The post-pandemic era has seen both the largest positive gap between the manufacturing and aggregate levels of activity and the largest negative gap between the information and aggregate levels of activity in the 33-year history of the LMCI. Moreover, while manufacturing and information are two of the most interest-rate-sensitive industries, their level of activity series diverged markedly during the Federal Open Market Committee’s 2022–23 round of policy tightening (Dilts Stedman and Pollard 2023).
Tightening monetary policy from March 2022 to July 2023 likely influenced the rapid decline in labor market activity in the information sector, consistent with previous tightening cycles. During the pandemic, technology firms borrowed large sums at low interest rates, growing their firms at a rapid pace and boosting hiring (Sayegh 2024; CNBC 2024). As the Federal Reserve began raising rates, companies shifted their focus from growth to profitability and began to lay off workers. Within a few months of the start of monetary policy tightening, announced job cuts in the information sector spiked, with cuts concentrated among technology firms.
In manufacturing, however, labor markets have remained resilient in the face of tighter monetary policy due to both fiscal policy and the realignment of supply chains. In particular, the CHIPS Act, Inflation Reduction Act, and Infrastructure Act have likely helped offset the contractionary effect of monetary policy in manufacturing (Sløk 2024). The manufacturing sector has also seen surging interest in reshoring in response to both supply chain disruptions during the pandemic and a rise in geopolitical tensions (McLaughlin and Peterson 2023). As a result, manufacturing capacity has increased markedly since the start of 2022, with strong spending on both manufacturing construction and equipment. Against this backdrop of expanding capacity, the manufacturing labor market remains strong relative to its long-run average. Indeed, in 2024, 13 of our 18 industry-level input variables appeared tighter relative to their long-run averages in the manufacturing industry than in the aggregate labor market._
We see similar patterns of tightness and weakness across industries when we look at hourly earnings growth, as shown in Chart 3. Hourly earnings growth provides a summary statistic of cost pressures generated by tight labor markets. The broad-based strength in manufacturing has translated into robust average hourly earnings growth (blue line), with the current growth rate above both its pre-pandemic level and the current aggregate level (black line). This strong growth contrasts with weaker-than-aggregate wage growth in the information industry (purple line), reflecting information’s weaker labor market. The strong growth in manufacturing also contrasts with more moderate growth in nonprofessional services (green line), one of the least interest-rate-sensitive sectors. Although earnings growth for nonprofessional services peaked well above the aggregate during the labor shortages of 2022, it has more recently returned to pre-pandemic rates and now tracks aggregate growth.
Chart 3: Hourly earnings growth provides a summary statistic of cost pressures generated by tight labor markets
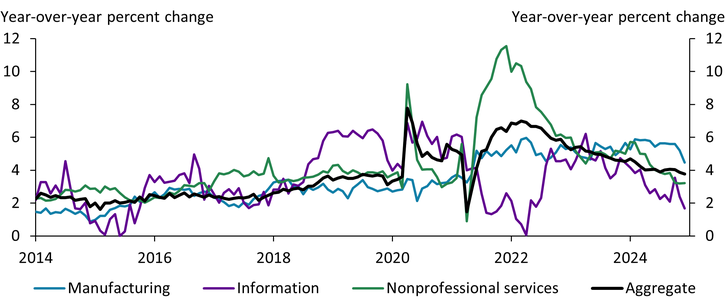
Sources: U.S. Bureau of Labor Statistics (Haver Analytics) and authors’ calculations.
The variations in labor market health and cost pressures across industries could have implications for monetary policy. On the inflation side of the dual mandate, tightness in labor-intensive industries stands to boost inflation more than that from capital-intensive industries._ While ongoing strength in manufacturing labor markets might continue to buoy wages in that industry, manufacturing is less labor-intensive and makes up a comparatively small share of total employment. Thus, this wage growth poses minimal risk to inflation. Importantly, labor market tightness, and in turn wage growth, has moderated in labor-intensive service industries such as nonprofessional services.
On the employment side of the dual mandate, pockets of weakness in the labor market could merit continued monitoring. Based on historical evidence, interest-rate-sensitive industries are expected to cool most after monetary policy tightening (Dilts Stedman and Pollard 2023). Although the information industry behaved in line with this expectation, with weakness outpacing the aggregate labor market, manufacturing did not, due to fiscal policy and the realignment of supply chains. If these effects wane and interest rates remain high, manufacturing labor markets may begin to cool. Overall, the industry-specific LMCI highlights the importance of monitoring individual industries, not just the aggregate labor market, for signs of stress.
Download Materials
Endnotes
-
1 Six input variables are not available at the industry level, so we use the aggregate version of these variables when calculating the industry-specific LMCI series. For more information, see the data appendix on the article’s webpage.
-
2 When looking at the raw data without comparing with long-run averages, only eight of the 18 industry-level input series appear tighter for the manufacturing sector than for the aggregate. However, the manufacturing labor market has generally seen weaker readings than the aggregate during our 33-year sample period. Therefore, current readings indicate the manufacturing sector is tighter relative to its long-run average.
-
3 Bundick, Smith, and Van der Meer (2023) show that goods inflation responds considerably less to aggregate labor market tightness compared with the response of services inflation, likely because the provision of services is labor intensive.
Article Citation
Dilts Stedman, Karlye, and Emily Pollard. 2025. "Labor Market Cooling Has Been Uneven Across Industries." Federal Reserve Bank of Kansas City, Economic Bulletin, January 31.
References
Bundick, Brent, A. Lee Smith, and Luca Van der Meer. 2023. “A Tight Labor Market Could Keep Rent Inflation Elevated.” Federal Reserve Bank of Kansas City, Economic Bulletin, March 1.
CNBC. 2024. “External LinkWhy Widespread Tech Layoffs Keep Happening Despite a Strong U.S. Economy.” February 23.
Dilts Stedman, Karlye, and Emily Pollard. 2023. “Why Has Monetary Policy Tightening Not Cooled the Labor Market Enough to Quell Inflation?” Federal Reserve Bank of Kansas City, Economic Bulletin, March 31.
McLaughlin, Erin, and Dana M. Peterson. 2023. “External LinkA Reshoring Renaissance Is Underway.” MIT Sloan Management Review, November 2.
Sayegh, Emil. 2024. “External LinkThe Great Tech Reset: Unpacking The Layoff Surge of 2024.” Forbes, August 19.
Sløk, Torsten. 2024. “External LinkThe New Industrial Renaissance.” Apollo Academy, Daily Spark, December 5.
Karlye Dilts Stedman is a senior economist at the Federal Reserve Bank of Kansas City. Emily Pollard is an associate economist at the bank. The views expressed are those of the authors and do not necessarily reflect the positions of the Federal Reserve Bank of Kansas City or the Federal Reserve System.
Authors

Karlye Dilts Stedman
Senior Economist