Consumption of goods and services other than housing has increased vigorously during recent years, growing at an average annual rate of more than 3.5 percent (adjusted for inflation) from 2014 to 2017. In contrast, consumption of housing—the estimated aggregate rent of all occupied housing units—has increased sluggishly, growing only slightly above 1.5 percent annually over the same period. The comparatively slow growth of housing consumption even as employment and income rise briskly suggests pent-up demand for housing may be increasing, both among existing households wishing to move into larger apartments or houses and among individuals wishing to leave their roommates and parents behind and form their own, new households by moving into vacant apartments or houses.
Consistent with increasing pent-up demand, the actual number of U.S. households has been falling increasingly below a benchmark projection based on the composition of households by age and sex in 2000 and changes in U.S. demographics since then (Rappaport 2013). Attributing half of this shortfall to long-run factors, such as rising student debt and the increasingly later age at which adults first marry, the actual number of households at the end of 2017 was probably about 3.5 million below its trend level (Rappaport 2015, 2017). Correspondingly, the headship rate—the ratio of the number of households to the population—has yet to start rebounding from the recession. The share of adults living with their parents has likewise failed to break from its recessionary behavior. For example, the share of adults age 30–34 living with their parents increased from 9.5 percent in 2006 to 13 percent in 2012 to 15 percent in 2016.
Meeting this pent-up demand for housing would require a large ramp up in construction. Single-family construction, which has historically accounted for about four-fifths of new units, has only partly rebounded from its crash during the last recession and remains very low by historical standards (Chart 1, blue line). In contrast, multifamily construction rebounded strongly following the recession but has since fallen off (green line), largely reflecting rising vacancy rates in luxury buildings, many near metropolitan downtowns. Vacancy rates for more moderately priced apartments remain very low.
Chart 1: Home starts
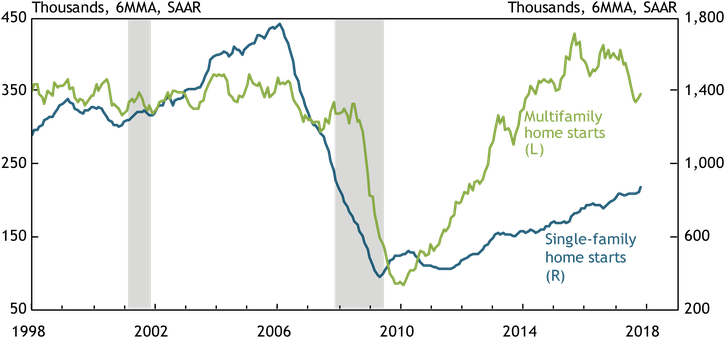
Notes: Data are through November. Gray bars denote National Bureau of Economic Research (NBER)-defined recessions.
Sources: Census Bureau (Haver Analytics) and NBER (Haver Analytics).
One factor constraining home construction is a shortage of qualified workers. Annualized growth in construction employment, both residential and nonresidential, slowed from 5 percent throughout much of 2014 and 2015 to less than 3 percent during 2017. Maintaining even this slower employment growth rate will be a challenge: the unemployment rate is already near its lowest in almost 50 years, and the U.S. working age population is expected to grow less than one-half percent in 2018.
Another factor constraining home construction is the limited availability of undeveloped land in desired locations. From before World War II through the housing boom of the early 2000s, single-family homes were primarily constructed in large subdivisions near metropolitan peripheries, which gradually pushed those peripheries farther from metropolitan downtowns. In many metros, this outward movement may have reached its geographical limit, as households are reluctant to take on increasingly long and congested commutes. Shifting single-family construction inward from the periphery will limit projects to a smaller scale. And the higher price of this land—as well as the cost of tearing down existing structures—has encouraged builders to focus on constructing higher-end homes to make a profit.
A third factor constraining home construction is land use regulation. In urban areas, builders face maximum density restrictions, caps on permits, and lengthy approval processes. And in suburban areas, minimum lot size and other requirements tightly restrict multifamily and high-density single-family construction.
Despite these constraints, single-family construction will likely continue to grow at about a 10 percent trend rate over the next few years. However, this growth is likely to oscillate significantly from quarter to quarter. Multifamily construction will likely stabilize in 2018 as the boom in downtown luxury projects unwinds.
The low rate of residential construction has been contributing to the tight supply of existing homes listed for sale. New construction provides liquidity to local housing markets, where households are often both buyers and sellers. With fewer new homes from which to choose, many homeowners considering upgrading have instead chosen to remain in their current homes and so have not listed them for sale. As a result, the number of existing homes for sale has decreased as well, dissuading other homeowners from upgrading and further dampening sales listings. This “vicious circle” has limited the efficacy of rising sales prices in eliciting more listings. Since early 2015, the number of single-family homes listed for sale has steadily declined (Chart 2, blue line). Correspondingly, the ratio of listed homes to monthly sales, also known as “months supply,” fell to 3.8 in November, its lowest value since 1982, the earliest date for which data are available (green line).
Chart 2: Sales listings of existing single-family homes
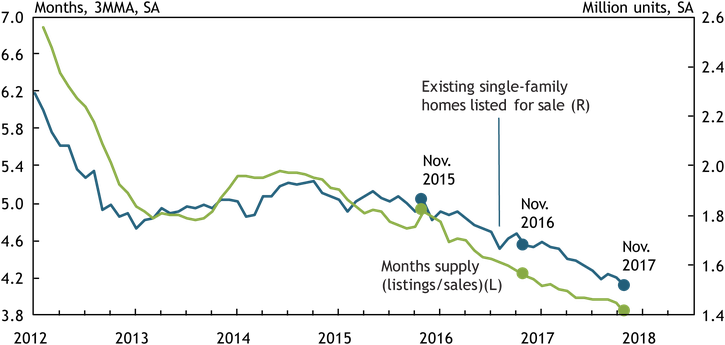
Note: Months supply shown above differs from the value released by the National Association of Realtors because of seasonal adjustment and smoothing.
Source: National Association of Realtors (Haver Analytics).
Limited new construction and sales listings of low-end single-family homes have similarly dissuaded many younger households from leaving their apartments to purchase homes, thereby depressing the number of vacant apartments available for potential new households.
The pent-up demand for housing has put strong upward pressure on both rents and sales prices, which are likely to continue rising throughout 2018. Multifamily rents have been rising at more than a 4 percent annual rate since mid-2014 (Chart 3, blue line). Single-family rent increased at a slightly slower rate in 2017 than in the previous year, but its annual growth rate nevertheless remains above 3 percent (orange line), significantly higher than the rate at which prices for most other goods and services increased. Growth of single-family sales prices accelerated from an annual rate of 5.5 percent at the start of 2017 to 7 percent by yearend (green line).
Chart 3: Rents and sales prices
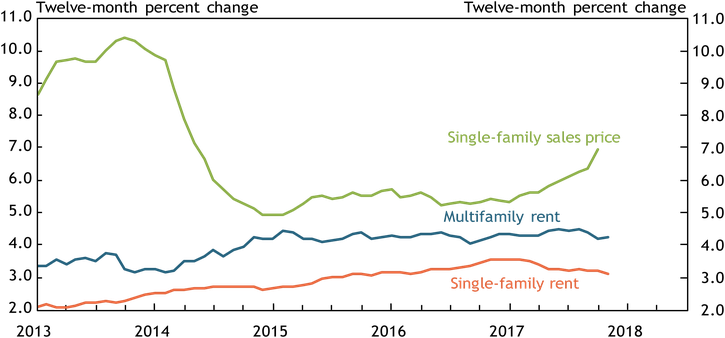
Notes: Data are through November. Single-family rent is measured by owner-equivalent rent. Multifamily rent is inferred from owner-equivalent rent and rent of primary residence.
Sources: CoreLogic (Haver Analytics) and Bureau of Labor Statistics (Haver Analytics).
Despite these elevated price increases, single-family homes on average do not appear to be significantly overvalued. To be sure, the national level of single-family home prices has risen back up to its peak prior to the housing crisis (Chart 4, blue line). But relative to single-family rents, national home prices remain only moderately higher than their average during the 1990s (orange line). Relative to capitalized rents—a benchmark valuation constructed by dividing the estimated annual rent for a home by the mortgage interest rate plus a 3 percent cost that captures ownership expenses—national home prices are below their average during the 1990s (green line), allowing some buffer to absorb increases in mortgage interest rates and modest downward pressure from recently enacted tax changes without reversing the upward price trend.
Chart 4: Single-family sales prices
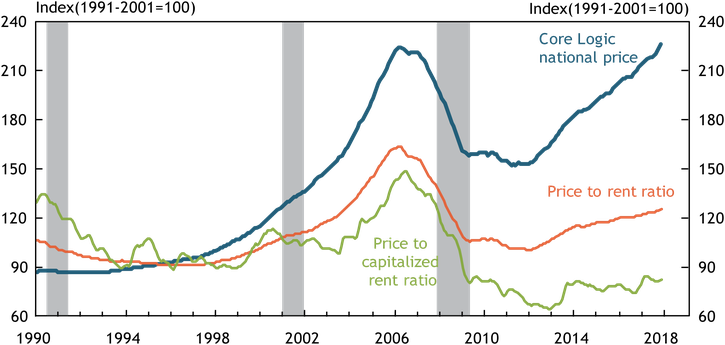
Notes: Data are through November. Capitalized rent is calculated as owner equivalent rent divided by the 30-year mortgage interest rate plus a 3 percent cost that captures ownership expenses.
Sources: CoreLogic (Haver Analytics), BLS (Haver Analytics), and Freddie Mac (Haver Analytics).
Looking beyond 2018, multifamily construction, which requires far less land and only half the labor input per unit as single-family construction, may be able to meet a large portion of pent-up demand as aging baby boomers increasingly downsize into multifamily units. This downsizing appears to be just now getting underway, as the leading edge of the baby boom, those born from 1946 to 1950, recently entered their late sixties. From 2010 to 2015, the share of these boomer households living in multifamily units increased by 1 percentage point, freeing up almost 100,000 single-family homes. The doubling of the standard tax deduction will likely accelerate this shift by significantly lowering the tax penalty of switching from homeownership to renting.
However, land-use regulations—especially in the suburbs—will considerably limit the ability of multifamily construction to meet pent-up demand. Numerous anecdotes suggest that downsizing baby boomers wish to continue to live near their current single-family homes, close to family and friends. Suburban municipalities that modify regulations to allow for more flexible land use are likely to benefit existing residents, both aging baby boomers and their adult children, as single-family homes turn over to younger households.
References
Rappaport, Jordan. 2017. “The Large Unmet Demand for Housing.” Federal Reserve Bank of Kansas City, The Macro Bulletin, April 12.
———. 2015. “Millennials, Baby Boomers, and Rebounding Multifamily Home Construction.” Federal Reserve Bank of Kansas City, Economic Review, vol. 100, no. 2, pp. 37–55.
———. 2013. “The Demographic Shift from Single-Family to Multifamily Housing.” Federal Reserve Bank of Kansas City, Economic Review, vol. 98, no. 4, pp. 29–58.
Jordan Rappaport is a senior economist at the Federal Reserve Bank of Kansas City. The views expressed are those of the author and do not necessarily reflect the positions of the Federal Reserve Bank of Kansas City or the Federal Reserve System.