Fed watchers like to characterize members of the Federal Open Market Committee (FOMC) as either “hawks” or “doves.” Hawks are viewed as favoring tighter monetary policy with an emphasis on controlling inflation. In contrast, doves are viewed as favoring easier monetary policy with an emphasis on maintaining maximum employment. In this Bulletin, we identify hawks and doves among the participants in FOMC meetings by their expressed views on policy as reported in documents released with FOMC transcripts._
FOMC meeting participants—the members of the Board of Governors and the 12 Reserve Bank presidents—submit individual economic projections in conjunction with four FOMC meetings a year. These projections (without attribution) are released to the public in conjunction with the Chair’s post-meeting press conference in the Summary of Economic Projections (SEP)._ Specifically, each FOMC participant provides projections for the current year and one to two years into the future for real GDP growth, unemployment, and headline and core inflation as measured by the personal consumption expenditure (PCE) price index._ The projections are made based on each participant’s view of appropriate monetary policy. Although the SEP reports the range and central tendencies of projections across Committee participants, it does not link the inflation and unemployment projections of individual participants to their preferred policy paths. In contrast, the Compilation and Summary of Individual Economic Projections—released to the public with FOMC meeting transcripts after a five-year lag—identifies participants by a random number and includes narratives that explain the rationale behind each participant’s views. Importantly, these narratives give participants an opportunity to discuss their views of the appropriate path of interest rates. Thus, the Compilation allows us to link participants’ views about the appropriate policy path with their projections for inflation and unemployment.
We examine the narratives included in the Compilation to identify hawks and doves over the period from 2009 to 2012. We identify hawks as participants who indicated their preferred policy path is above the Board staff’s policy path or suggested the target federal funds rate rise faster than implied by existing forward guidance._ For example, at the April 26–27, 2011 FOMC meeting, participant #6 said, “I believe it will be necessary to begin removing monetary-policy accommodation earlier than is assumed by the Board staff, and to pursue [interest rate] normalization more vigorously” (p. 17).
We identify doves as participants who indicated their preferred policy path is below the Board staff’s policy path or suggested the target funds rate rise at a slower rate than implied by existing forward guidance. For example, at the November 1–2, 2011 FOMC meeting, participant #4 said, “My path for monetary policy is more accommodative than that assumed in the staff forecast. I would hold the funds rate in its current range until the last quarter of 2014 and communicate an intention to raise the funds rate, once lift-off commences, more gradually than assumed in the Tealbook baseline” (p.19). (The Tealbook is the document that describes the Board staff’s outlook.)
Once we have identified the hawks and doves among Committee participants, we determine their corresponding projections for inflation and unemployment._ Chart 1 plots these projections for the “current” year—the year in which the FOMC meeting was held. Charts 2 and 3 plot these projections for the following two years. Blue dots indicate hawks, while green dots indicate doves. In each chart, the deviation of individual inflation projections from the median inflation projection is on the vertical axis, while the deviation of individual unemployment projections is on the horizontal axis.
Chart 1: Current-Year Projections
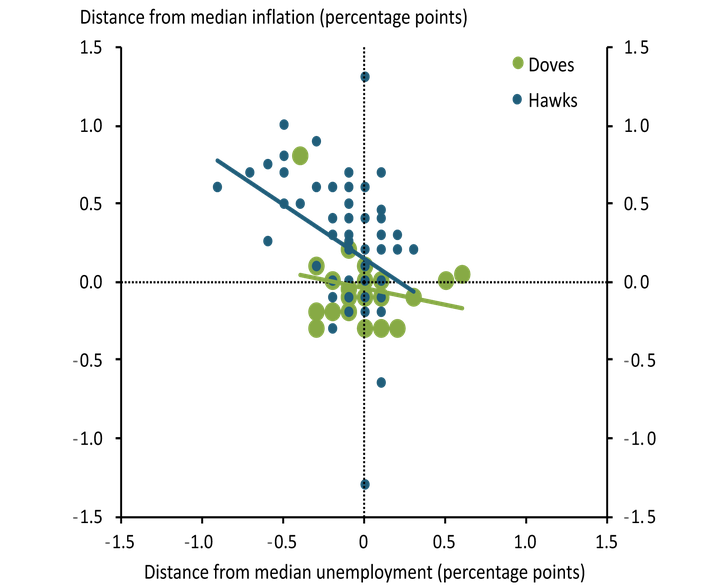
Sources: Summary of Economic Projections and authors’ calculations
Three conclusions emerge from the charts. First, hawks generally project higher inflation than doves at all three projection horizons despite having a tighter policy path. Doves project lower inflation despite having an easier policy path. These differences persist even at a two-year projection horizon, possibly reflecting the view that inflation is characterized by considerable inertia and that monetary policy acts with a lag. However, the difference between hawks and doves shrinks as the horizon increases. Second, differences in unemployment projections between hawks and doves are less pronounced at all horizons. However, there is some evidence that hawks project lower rates of unemployment in the current-year and next-year projections than doves. Third, the correlation between inflation and unemployment projections suggests that hawks see a steeper tradeoff between inflation and unemployment in the current year and next year. In other words, hawks view any given decrease in unemployment as being associated with a bigger increase in inflation than doves. However, this difference disappears at the two-year horizon.
Chart 2: One-Year-Ahead Projections
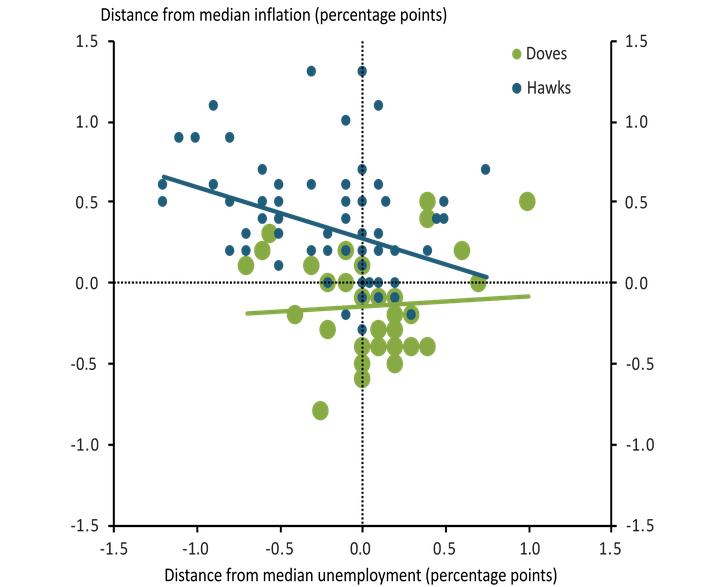
Sources: Summary of Economic Projections and authors’ calculations
Chart 3: Two-Year-Ahead Projections
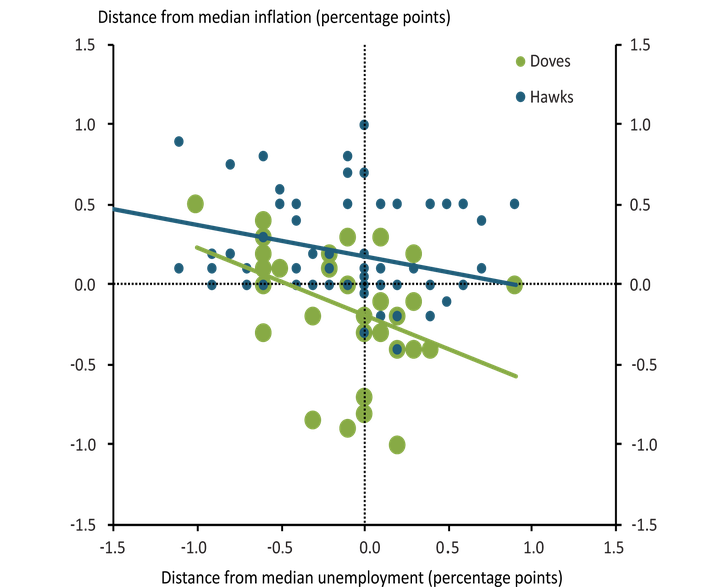
Sources: Summary of Economic Projections and authors’ calculations
Endnotes
-
1
Malmendier, Nagel, and Yan (2017) examine how personal experiences with inflation influence whether FOMC participants tend to be hawkish or dovish.
-
2
Before April 2011, the SEP was included as an addendum to the minutes that are released three weeks after the meeting.
-
3
The SEP also includes projections for the longer-run values of these variables. In addition, since 2012, the SEP has also included FOMC participants’ end-of-year projections for the federal funds rate. For more information on the evolution of the SEP, see Kahn and Palmer (2016).
-
4
We identify hawks and doves using the narratives because the SEP did not include projections for the federal funds rate until 2012. Although we could also use actual federal funds rate projections of individual participants in 2012 for this purpose, we instead maintain the approach we use for 2009–11.
-
5
Based on the narratives in the Compilation and Summary of Individual Economic Projections, we cannot classify most FOMC participants as either hawks or doves. On average, we classify four to five participants per meeting as hawks but only two per meeting as doves. In addition, we cannot tell if these participants are the same individuals from meeting to meeting.
References
Federal Open Market Committee (FOMC). 2009–12. Compilation and Summary of Individual Economic Projections. Available at https://www.federalreserve.gov/monetarypolicy/fomc_historical.htm
Kahn, George A., and Andrew Palmer. 2016. “Monetary Policy at the Zero Lower Bound: Revelations from the FOMC’s Summary of Economic Projections.” Federal Reserve Bank of Kansas City, Economic Review, vol. 101, no. 1, pp. 5-37.
Malmendier, Ulrike, Stefan Nagel, and Zhen Yan. 2017. “The Making of Hawks and Doves: Inflation Experience on the FOMC.” NBER Working Paper no. 23228, March.
George A. Kahn is a vice president and economist at the Federal Reserve Bank of Kansas City. Amy Oksol is a research associate at the bank. The views expressed are those of the authors and do not necessarily reflect the positions of the Federal Reserve Bank of Kansas City or the Federal Reserve System.