When the COVID-19 pandemic delivered a swift and sudden blow to the U.S. economy earlier this year, Congress passed unprecedented fiscal stimulus packages in response. These fiscal actions, together with monetary policy interventions from the Federal Reserve, have provided timely assistance to households and businesses, supporting a relatively quick, but so far partial, rebound of economic activity. However, the fiscal stimulus also led to a sharp increase in federal debt, raising concerns about future fiscal sustainability.
Chart 1 shows that the Congressional Budget Office (CBO) currently projects federal government debt to rise to 98 percent of GDP in 2020, up from its projection of 80 percent made one year ago (CBO 2019, 2020). If current laws governing taxes and spending generally remain unchanged, the CBO expects debt to reach 195 percent of GDP by 2050, an estimate 50 percentage points higher than what it projected in 2019. This increase in the projected debt level in 2050 reflects the CBO’s forecasts of higher interest payments and slower economic growth, both of which are associated with growing debt.
Chart 1: Federal Government Debt Projections
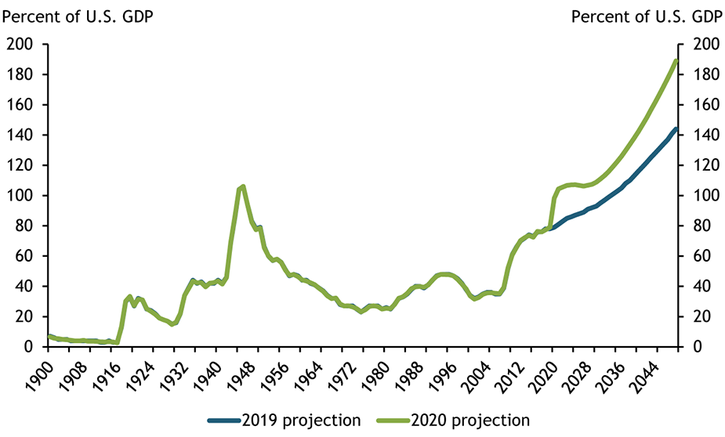
Note: Chart shows federal government debt held by the public, which includes debt held by the Federal Reserve.
Source: CBO.
U.S. federal government debt is financed through the sale of U.S. Treasuries, which are widely considered to be some of the safest securities in the world. Nevertheless, every country faces a fiscal limit at which, for economic or political reasons, taxes and spending can no longer adjust to stabilize debt. As a country approaches this limit, the probability of default increases until the debt ultimately becomes unsustainable._ To assess the fiscal sustainability of projected U.S. debt, we compute fiscal limits for the U.S. federal government following the approach in Bi, Shen, and Yang (2020). Specifically, we use a standard asset pricing model and calculate a government’s fiscal limit as the discounted sum of the maximum fiscal surplus that it can possibly raise in the future. In this way, a government’s fiscal limit depends heavily on its future fiscal policy: higher expected fiscal surpluses, either through higher taxes or lower government spending, can increase the fiscal limit.
Fiscal limits account for future economic and policy uncertainty; thus, a fiscal limit is not a fixed number but instead a probability distribution. The blue line in Chart 2 shows how the government’s probability of default evolves with the debt level under a baseline scenario for taxes and spending. This baseline scenario relies on two assumptions._ First, we assume that the maximum tax rates cannot be predicted precisely and thus draw them from distributions based on past income tax rates._ In addition, we assume that within the next 30 years, the government will adopt a reform to stabilize mandatory spending as a share of GDP, which has been rising over the past several decades due to demographic shifts that have increased demand for government-sponsored retirement and health-care benefits.
Chart 2: Fiscal Limit Distributions of the U.S. Federal Government
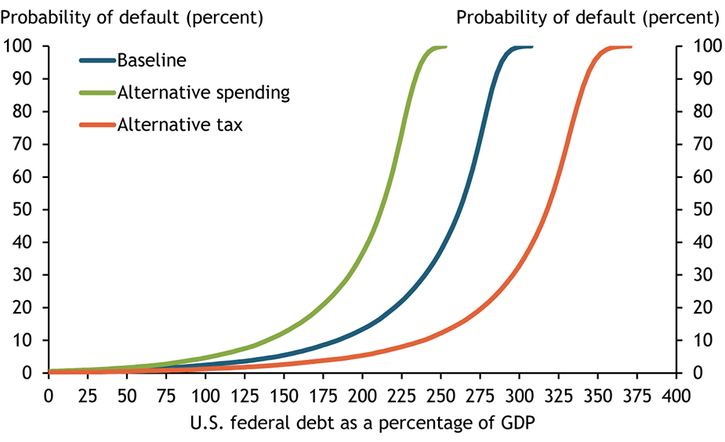
Source: Authors’ calculations.
Under the baseline scenario, the probability of default is virtually zero at the current net federal debt level of about 100 percent of GDP. The risks, however, rise quickly as debt continues to grow beyond certain thresholds. For example, the probability of default reaches 10 percent at the debt level of 190 percent of GDP. At debt levels above 200 percent of GDP, the probability of default increases dramatically.
The assumptions in the baseline scenario about future fiscal policy may not hold, as the federal government’s capacity to collect taxes and stabilize spending is constrained by both economic and political factors. The government may be able to raise taxes beyond historical levels, but higher taxes may create disincentive to work and invest and may also be politically challenging. In addition, it is highly uncertain whether or when the government will adopt fiscal reforms to stabilize mandatory spending. Therefore, we consider two alternative scenarios to highlight the effect of future fiscal policy on fiscal limits. In the first alternative scenario, we assume that the government will not pass an entitlement reform in the next 30 years and that mandatory spending will follow the CBO’s projection under current law. This policy change lowers the fiscal limit significantly, as shown by the green line in Chart 2. Specifically, the probability of default reaches 10 percent when the debt level is 150 percent of GDP, the CBO’s projection for federal debt in the year 2042. In the second alternative scenario, we assume that the government can raise tax rates further and also pass an entitlement reform within the next 30 years. These policy changes increase the fiscal limit, as shown by the orange line in Chart 2._ In this scenario, debt levels in line with the CBO’s debt projections throughout 2049 do not pose a threat to fiscal sustainability.
The unprecedented fiscal stimulus packages in response to the COVID-19 pandemic have provided timely and much needed support to households and businesses. However, this massive fiscal support has a high budgetary cost and has added to concerns about federal debt sustainability. Our analysis suggests the U.S. federal government still has some fiscal room to maneuver at the current debt level of almost 100 percent of GDP. Over the longer horizon, debt sustainability will depend, to a large extent, on future fiscal policies—specifically, whether the government can curb mandatory spending and raise taxes.
Endnotes
-
1
We abstract from the possibility of monetizing government debt. Fiscal surpluses are the difference between tax revenues and government spending. Bi (2017) and Bi, Shen, and Yang (2020) provide detailed discussions on the framework.
-
2
Specifically, the default probability is the likelihood that a given current debt level would exceed a randomly drawn limit from a simulated fiscal limit distribution.
-
3
Using the data series constructed by Barro and Redlick (2011), we assume that the distribution of maximum average labor income tax rates centers at 0.34 with a standard deviation of 0.05. The distribution implies that 95 percent of maximum average labor tax rates fall within the range of [0.24, 0.44]. In addition, we set the distribution of the maximum capital income tax rate to center at 0.24, the peak of observed average capital tax rates during the post-1980 period.
-
4
In this alternative scenario, we assume that the maximum labor income tax rates increase by 4 percentage points, and the maximum capital tax rate to center at 0.26.
References
Barro, Robert J., and Charles J. Redlick. 2011. “External LinkMacroeconomic Effects from Government Purchases and Taxes.” Quarterly Journal of Economics, vol. 126, no. 1, pp. 51–102.
Bi, Huixin. 2017. “Fiscal Sustainability: A Cross-Country Analysis.” Federal Reserve Bank of Kansas City, Economic Review, vol. 102, no. 4, pp. 5–25.
Bi, Huixin, Wenyi Shen, and Susan Yang. 2020. “Fiscal Implications of Interest Rate Normalization in the United States.” Federal Reserve Bank of Kansas City, Research Working Paper no. 20-12, September.
CBO (Congressional Budget Office). 2020. “External LinkThe 2020 Long-Term Budget Outlook.” Washington, DC, September.
———. 2019. “External LinkThe 2019 Long-Term Budget Outlook.” Washington, DC, June.
Huixin Bi is a research and policy officer at the Federal Reserve Bank of Kansas City. Wenyi Shen is an associate professor at the Department of Economics at Oklahoma State University. Shu-Chun S. Yang is a senior economist at the Fiscal Affairs Department of the International Monetary Fund. The views expressed are those of the authors and do not necessarily reflect the positions of the Federal Reserve Bank of Kansas City and the Federal Reserve System. Also, the views expressed in this article do not necessarily represent the views of the IMF, its Executive Board, or IMF management.