To owners of taxi medallions, the permits that allow taxis to operate in New York City, economic innovation may seem unpleasantly rapid. After peaking at just over $1 million in 2013, the medallions’ value declined by almost 25 percent in a little over a year. The reason? The emergence of a competing business model known as ridesharing.
To economists, however, innovation may seem sluggish. Growth in gross domestic product has consistently fallen short of expectations during what has been the slowest post-war economic expansion on record. Might the economic data be missing a boost from rising segments of the economy such as ridesharing services?
This Macro Bulletin suggests the answer is “yes”—that is, current economic data may not fully capture the activity generated by ridesharing services. The macroeconomic importance of this finding is tempered by the still-small scale of this activity. But as ridesharing and other dimensions of the sharing economy take hold more broadly, capturing their contributions will become increasingly important.
Conceptually, measuring the output of the sharing economy is straightforward. The technology and business model may be novel—firms facilitate peer-to-peer transactions through Internet-based platforms—but the fundamental services being delivered are not. In the case of ridesharing, platforms such as Uber, Lyft, or other similar services match ride-seekers with drivers in much the same way a traditional taxi dispatcher would. GDP accounting practices should thus measure ridesharing as boosting the taxicab services category of economic output (Ahmad and Schreyer).
Yet in practice, a significant portion of the economic value of ridesharing services appears to go unmeasured. Chart 1 shows public interest in Uber, the dominant platform in the industry, rose rapidly in 2014, according to the Google Trends measure of internet searches. This surge corresponded with a rising number of rides booked through Uber’s platform (Hall and Krueger). In the GDP data, however, inflation-adjusted spending on taxicab services in 2014 instead started to decline (Chart 2).
Chart 1: Google searches for the major platforms
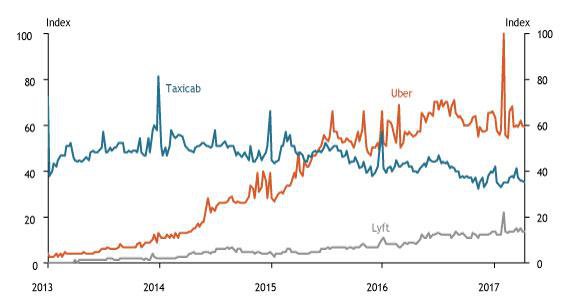
Note: Searches for “taxi” and “cab” separately show a similar trend to searches for “taxicabs.”
Source: Google Trends.
This decline in spending on taxicab services is almost certainly a measurement issue. After all, in New York City, where reporting requirements on the taxicab services industry are especially stringent, the overall market for rides increased by 17 percent between the first half of 2014 and the second half of 2015, even as rides provided by traditional taxi providers fell 12 percent (New York City Taxi & Limousine Commission). In a national poll conducted by the Pew Research Center, 15 percent of American adults reported they had used ridesharing services by December 2015, and a portion of these rides likely represented an overall boost to the broader taxicab services market. But the data show taxicab services as a drag on real GDP growth instead, likely due to measurement errors that affect both the nominal estimate of activity in the sector and the price index used to deflate this measure.
One source of mismeasurement likely results from relying largely on surveys of employers to generate industry-level estimates of economic activity (Bean). While many traditional taxi drivers are on the payroll of employer firms, drivers for ridesharing platforms are generally considered to be independent contractors in “individual proprietorships,” as they are not direct employees of those platforms. Employer-based surveys such as the Quarterly Services Survey, which is a key input into the quarterly estimate of taxicab services spending, capture overall activity in the sector well only when revenue growth remains similar between both employer firms and individual proprietorships.
Chart 2: Inflation-adjusted spending on taxicabs
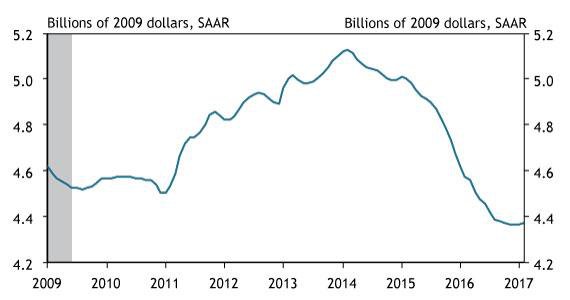
Note: The chart shows real personal consumption expenditures (PCE) on taxicabs at a seasonally adjusted annual rate (SAAR). Gray bars denote National Bureau of Economic Research (NBER)-defined recessions.
Sources: Bureau of Economic Analysis and NBER (Haver Analytics)
But as Chart 3 shows, their growth rates have diverged. The number of individual proprietorships in the taxi and limousine industry soared in 2014, the last year for which data are available, even as employment growth at employer firms began to stall. In fact, monthly data through February 2017 show payroll employment over 6 percent below its February 2016 level (not shown). The contrast between blockbuster growth in the number of individual proprietorships and stagnation in the number of payroll employees suggests ride-sharing platforms have eaten away at the market share of traditional taxi providers, thereby leading employer-based surveys to depress estimates of nominal taxicab services spending._
Chart 3: Payroll employees and individual proprietorships in taxi and limousine services
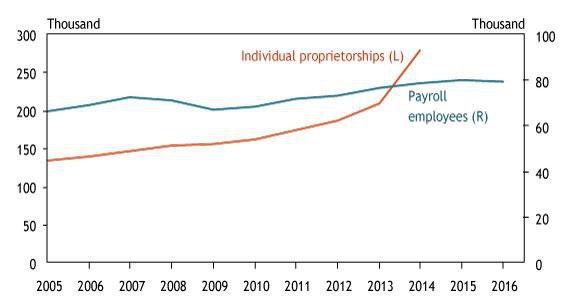
Sources: Bureau of Labor Statistics and U.S. Census Bureau.
Another source of mismeasurement may result from relying on provider-specific prices to generate the price index. In the taxicab services market, the time series of measured prices used to create the price index should include the price of a particular ride provided by both a traditional dispatcher and a ridesharing platform. The price index, however, does not capture the decline in price from a consumer’s perspective when they switch to a lower-cost provider for the same service, such as from a traditional taxi provider to a cheaper ridesharing platform. This oversight is known as “outlet substitution bias” and is a well-documented issue with the GDP methodology (Hausman). The taxicab services price index has been growing more slowly in recent years than in the past, possibly because ridesharing platforms have placed downward pressure on traditional taxi providers’ pricing power. But Chart 4 shows the price level has not fallen—even though over two-thirds of users view ridesharing as a cheaper alternative to traditional taxis (Pew Research Center)._
Although the current measurement framework may be deficient in some respects, this finding has limited macroeconomic implications. First, the sharing economy is too small to noticeably affect measures of aggregate GDP growth. While public data on revenue are not available for these privately held firms, company-sponsored research indicates Uber drivers generated about $2.5 billion in U.S. revenue in 2015 (OECD). Uber’s revenue is large relative to the taxicab services industry but small in the context of the then-$18 trillion U.S. economy.
Second, economic data are likely to better capture the sharing economy’s output over time. Revenues generated by platform drivers will eventually influence GDP through the normal revisions process, which incorporates the best available source material, including tax records, into the data over time. Underreporting of income does not pose a major threat to the integrity of the income data, as most providers of ridesharing services are legally required to file business income tax forms.
Finally, measurement challenges created by emerging forms of economic activity are nothing new. Outlet substitution bias was widely documented as distorting GDP in the 1990s, when many shoppers switched from traditional retailers to lower-priced superstores (Hausman). Likewise, new goods and services usually enter into GDP with a lag: ridesharing services are not the only segment of the economy that surveys of activity might initially miss.
In all, the GDP data do not appear to fully capture the emerging ridesharing industry’s effects, though this finding has limited implications for the macroeconomy. While ridesharing provides a clear case in which GDP may not capture the sharing economy’s recent contributions, the same measurement difficulties are likely present for other services, including homesharing through online platforms such as Airbnb. As this segment of the economy grows, capturing its economic contributions will become increasingly important.
Chart 4: PCE price index for taxicab services
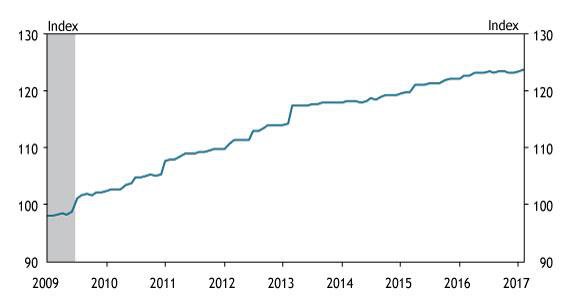
Note: Gray bars denote NBER-defined recessions.
Sources: National Association of Realtors (Haver Analytics), NBER (Haver Analytics), U.S. Census Bureau (Haver Analytics), and author’s calculations.
Endnotes
-
1
Revenues generated by the platforms themselves, which take a cut of the fare from each ride, may appear in employer-based surveys whenever those platforms are selected into the survey’s sample; however, revenues generated by platform-enabled freelancers would still be missing.
-
2
While traditional taxis and ridesharing may differ in other respects, such as safety and convenience (for better or for worse), these types of considerations fall outside the GDP framework.
References
Ahmad, Nadim, and Paul Schreyer. 2016. "External LinkMeasuring GDP in a Digitalised Economy." OECD Statistics Working Paper no. 73, June.
Bean, Sir Charles. 2016. "External LinkIndependent Review of UK Economic Statistics: Final Report."
Hall, Jonathan, and Alan Krueger. 2016. "External LinkAn Analysis of the Labor Market for Uber’s Driver-Partners in the United States." NBER Working Paper no. 22843, November.
Hausman, Jerry. 2003. "External LinkSources of Bias and Solutions to Bias in the Consumer Price Index." The Journal of Economic Perspectives, vol. 17, no. 1, pp. 23–44.
New York City Taxi & Limousine Commission. 2016. “2016 TLC Factbook.”
OECD. 2016. "External LinkNew Forms of Work in the Digital Economy." 2016 Ministerial Meeting on the Digital Economy: Technical Report, OECD Digital Economy Papers no. 260.
Smith, Aaron. 2016. "External LinkShared, Collaborative, and On Demand: The New Digital Economy." Pew Research Center, May 19.
Michael Redmond is an associate economist at the Federal Reserve Bank of Kansas City. The views expressed are those of the author and do not necessarily reflect the positions of the Federal Reserve Bank of Kansas City or the Federal Reserve System.