Understanding inflation dynamics is of central importance to monetary policy makers. One property of inflation is its persistence, which refers to the long-lasting effects of shocks to inflation. If inflation is more persistent, it is easier to forecast—which is important for policymakers, because monetary policy works with lags. However, persistent deviations of inflation from policymakers’ inflation target can also affect the possible trade-off between stabilizing inflation and economic output: if inflation is more persistent, policymakers may be keener to avoid inflation that is too high or too low, which may require larger deviations of output from its normal level._
Several empirical studies have documented a decline in inflation persistence around the early 1980s._ We illustrate this decline by showing changes in inflation and its persistence over two periods: 1970–84 and 1985–2008. Chart 1 displays the average of the annualized inflation rate, measured by the price index for personal consumption expenditures, and its autocorrelation. The autocorrelation is an indicator of persistence with a maximum value of 1; higher values indicate greater persistence. From 1970 to 1984, inflation averaged 6.5 percent per year, and its autocorrelation was 0.82. From 1985 to 2008, inflation averaged only 2.5 percent, and its autocorrelation fell to 0.33. Thus, both the level of inflation and its persistence, as measured by the autocorrelation, declined substantially.
Chart 1: Inflation and Its Persistence
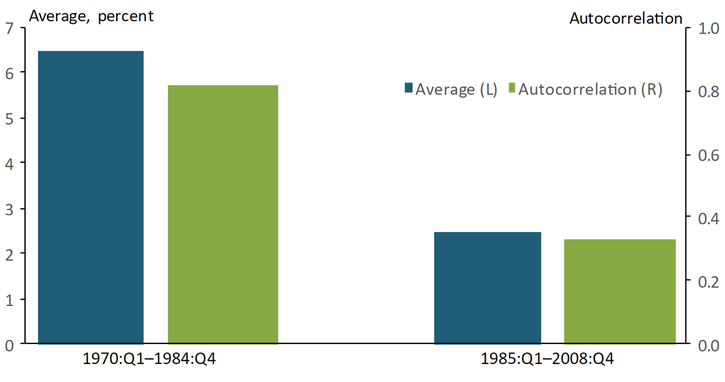
Notes: Chart shows the average and first-order autocorrelation of the annualized percent change in the price index for personal consumption expenditures.
Sources: Bureau of Economic Analysis (Haver Analytics) and authors’ calculations.
The most common explanation for the observed decline in inflation persistence is that monetary policy makers responded more aggressively to inflation during this period. Indeed, studies estimating interest rate rules that describe central bank behavior find that the policy response to inflation became stronger in the early 1980s._ To interpret the decline in inflation persistence, researchers build models of the economy that contain an interest rate rule to describe monetary policy and a Phillips curve to describe inflation dynamics. Researchers emphasize the policy response for two reasons: first, an aggressive policy response lessens the influence of past inflation on inflation dynamics. Second, an aggressive policy response shifts the weight of shocks that drive inflation from more persistent shocks to less persistent ones._
In a recent paper, we develop a new Phillips curve model of inflation dynamics that can capture the persistence of U.S. inflation (Kurozumi and Van Zandweghe 2018). Our model differs from most others because it does not rely on lags of inflation, which often arise from assumptions with scant empirical support, or on persistent shocks to generate inflation persistence. Instead, firms in our model that raise their product prices are faced with increasingly price-sensitive demand for their products, which weakens their pricing power. As a result, firms change prices incrementally, which leads to inflation persistence. Furthermore, unlike in most Phillips curve models, inflation dynamics in our model depend on the average or trend level of inflation, so the model may shed light on the positive relationship between average inflation and its persistence, as illustrated in Chart 1.
Our Phillips curve model predicts that a lower trend inflation rate reduces inflation persistence, consistent with the decline in persistence observed around the time of the Volcker disinflation. The response of inflation to a surprise change in the stance of monetary policy provides a way of measuring persistence in the model. The longer it takes for inflation to return to its previous level after a shock, the more persistent inflation is. Chart 2 shows that inflation dynamics are more persistent when trend inflation is 6.5 percent annually, as during the 1970s and early 1980s, than when it is 2.0 percent annually, which has been the FOMC’s inflation target since 2012.
Chart 2: Response of Inflation to a Surprise Monetary Policy Easing
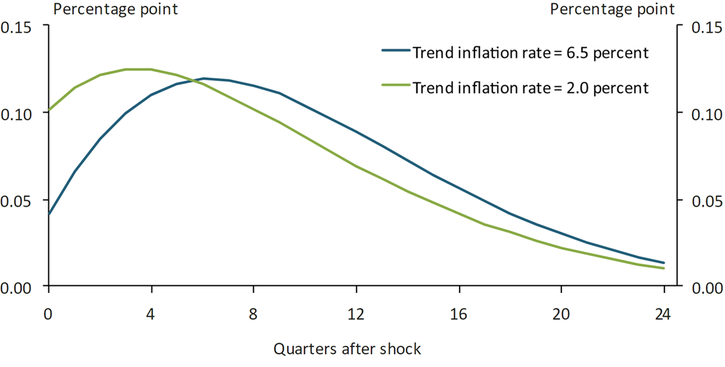
Note: Chart shows the response of inflation to a −70 basis point shock to the short-term interest rate.
Source: Kurozumi and Van Zandweghe (2018, Figure 6).
The persistence of an inflation response can be captured in a single number called the half-life, which states how long after a shock it takes for inflation to fall to half its initial value. When trend inflation is 6.5 percent, the half-life of the inflation response is 22 quarters; when trend inflation is 2.0 percent, the half-life of the inflation response declines to 14 quarters. Therefore, our model indicates that lower trend inflation contributed to the observed decline in inflation persistence around the early 1980s.
Our analysis provides a new perspective on the role of monetary policy in shaping inflation dynamics that may have implications for future policy. In recent years, researchers and monetary policy makers have debated the costs and benefits of adopting a higher inflation target. While most central banks target an inflation rate of or near 2 percent, the Great Recession and ensuing period of near-zero interest rates highlighted the possible benefits of a higher inflation target._ Our model’s prediction that higher trend inflation would raise inflation persistence highlights a previously overlooked cost. By adopting a higher inflation target, a central bank may increase inflation persistence, which could increase the cost of stabilizing inflation by requiring larger deviations in economic output from its normal level.
Endnotes
-
1
Steinsson (2003) analyzes implications of inflation persistence for optimal monetary policy.
-
2
Studies concluding that a decline in inflation persistence occurred around the early 1980s include Cogley and Sargent (2002), Stock and Watson (2007), and Cogley, Primiceri, and Sargent (2010). Some other studies, including Benati (2008) and Pivetta and Reis (2007), find no such decline. The different findings are due to differences in the methods used for measuring persistence and in the measures of inflation.
-
3
See Clarida, Gali, and Gertler (2000), Lubik and Schorfheide (2004), Coibion and Gorodnichenko (2011), and Hirose, Kurozumi, and Van Zandweghe (2017).
-
4
See Benati and Surico (2008), Carlstrom, Fuerst, and Paustian (2009), and Davig and Doh (2014). Cogley, Primiceri, and Sargent (2010) attribute lower persistence in the inflation gap—the gap between actual and trend inflation—primarily to a reduced variability of the trend inflation rate, because in their model shocks to trend inflation cause fluctuations in the inflation gap.
-
5
Blanchard, Dell’Ariccia, and Mauro (2010) ask whether the costs of 4 percent inflation are much higher than 2 percent inflation and propose that researchers reevaluate the costs and benefits of a higher inflation target.
References
Benati, Luca. 2008. “External LinkInvestigating Inflation Persistence Across Monetary Regimes.” Quarterly Journal of Economics, vol. 123, no. 3, pp. 1005-1060.
Benati, Luca, and Paolo Surico. 2008. “External LinkEvolving U.S. Monetary Policy and the Decline of Inflation Persistence.” Journal of the European Economic Association, vol. 6, no. 2-3, pp. 634−646.
Blanchard, Olivier, Giovanni Dell’Ariccia, and Paolo Mauro. 2010. “External LinkRethinking Macroeconomic Policy.” Journal of Money, Credit and Banking, vol. 42, no. S1, pp. 199−215.
Carlstrom, Charles T., Timothy S. Fuerst, and Matthias Paustian. 2009. “External LinkInflation Persistence, Monetary Policy, and the Great Moderation.” Journal of Money, Credit and Banking, vol. 41, no. 4, pp. 767−786.
Clarida, Richard, Jordi Galí, and Mark Gertler. 2000. “External LinkMonetary Policy Rules and Macroeconomic Stability: Evidence and Some Theory.” Quarterly Journal of Economics, vol. 115, no. 1, pp. 147.
Cogley, Timothy, Giorgio E. Primiceri, and Thomas J. Sargent. 2010. “External LinkInflation-Gap Persistence in the U.S..” American Economic Journal: Macroeconomics, vol. 2, no. 1, pp. 43−69.
Cogley, Timothy, and Thomas J. Sargent. 2002. “External LinkEvolving Post-World War II U.S. Inflation Dynamics,” in Ben S. Bernanke and Kenneth Rogoff, eds., NBER Macroeconomics Annual, vol. 16, pp. 331–373.
Coibion, Olivier, and Yuriy Gorodnichenko. 2011. “External LinkMonetary Policy, Trend Inflation, and the Great Moderation: An Alternative Interpretation.” American Economic Review, vol. 101, no. 1, pp. 341−370.
Davig, Troy, and Taeyoung Doh. 2014. “External LinkMonetary Policy Regime Shifts and Inflation Persistence.” The Review of Economics and Statistics, vol. 96, no. 5, pp. 862−875.
Hirose, Yasuo, Takushi Kurozumi, and Willem Van Zandweghe. 2017. “Monetary Policy and Macroeconomic Stability Revisited.” Federal Reserve Bank of Kansas City, Research Working Paper no. 17-01, January.
Kurozumi, Takushi, and Willem Van Zandweghe. 2018.“Variable Elasticity Demand and Inflation Persistence.” Federal Reserve Bank of Kansas City, Research Working Paper no. 16-09, April.
Lubik, Thomas A., and Frank Schorfheide. 2004. “External LinkTesting for Indeterminacy: An Application to U.S. Monetary Policy.” American Economic Review, vol. 94, no. 1, pp. 190−217.
Pivetta, Frederic, and Ricardo Reis. 2007. “External LinkThe Persistence of Inflation in the United States.” Journal of Economic Dynamics and Control, vol. 31, no. 4, pp. 1326−1358.
Steinsson, Jón. 2003. “External LinkOptimal Monetary Policy in an Economy with Inflation Persistence.” Journal of Monetary Economics, vol. 50, no. 7, pp. 1425−1456.
Stock, James H., and Mark W. Watson. 2007. “External LinkWhy Has U.S. Inflation Become Harder to Forecast?” Journal of Money, Credit and Banking, vol. 39, no. S1, pp. 4−33.
Takushi Kurozumi is a director and senior economist at the Bank of Japan. Willem Van Zandweghe is an assistant vice president and economist at the Federal Reserve Bank of Kansas City. The views expressed are those of the authors and do not necessarily reflect the positions of the Bank of Japan, the Federal Reserve Bank of Kansas City or the Federal Reserve System.