As crypto assets such as stablecoins have gained traction in recent years, they have also raised financial stability concerns. The attention has likely been motivated by a steady stream of stablecoin collapses, which are essentially bank runs. One approach to mitigating this risk could be to insure stablecoins in a way similar to bank deposits—that is, with a third-party guarantee to cover the depositor’s (or coin-holder’s) losses should the bank (or issuer) collapse. Because stablecoins have many functional similarities to bank deposits, the theory underlying deposit insurance pricing may be applicable to pricing insurance for stablecoins.
Stefan Jacewitz and Chris Acker estimate the cost of guaranteeing against stablecoin losses using standard option pricing methods as applied to bank deposit insurance. Using this technique on four major (unnamed) stablecoins, they estimate that the annualized cost to guarantee stablecoins against losses for 90 days ranges from nearly zero to almost $0.13 per dollar of stablecoins. These estimates vary substantially among stablecoin issuers and across time. Understanding these estimates could be useful to policymakers in evaluating proposals for stablecoin insurance or as a reference point from which to assess possible alternatives.
Introduction
As crypto assets such as stablecoins have gained traction in recent years, they have also raised financial stability concerns. In 2022, the Financial Stability Oversight Council, a U.S. government body responsible for identifying risks to financial stability and responding to emerging threats, concluded that stablecoins are a potential vulnerability in the U.S. financial system (FSOC 2022). The Federal Reserve’s Vice Chair for Supervision and the U.S. Secretary of Treasury have publicly agreed (Bloomberg 2023; Kiernan 2022). This attention is likely motivated by a steady stream of stablecoin collapses, from Basis Cash in 2020 to Iron’s TITAN in 2021 to Terra’s UST in 2022 to the financial turmoil in March 2023 (ultimately halted by extraordinary government action). These collapses are essentially bank runs—in both cases, coin-holders or depositors lose confidence in the institution and race to withdraw cash before it runs out. As observed during the Great Depression and the 2008–09 financial crisis, runs can have devastating effects on the broader economy.
One approach to mitigating this risk could be to insure stablecoins in a way similar to bank deposits—that is, with a third-party guarantee to cover the depositor’s (or coin-holder’s) losses should the bank (or issuer) collapse. Although stablecoins exist largely outside of the traditional, regulated financial landscape, they have many functional similarities with bank deposits. Accordingly, the theory underlying deposit insurance pricing may be applicable to pricing insurance for stablecoins.
In this article, we estimate the cost of guaranteeing against stablecoin losses using standard option pricing methods as applied to bank deposit insurance. Using this technique on four major (unnamed) stablecoins, we estimate that the annualized cost to guarantee stablecoins against losses for 90 days ranges from nearly zero to almost $0.13 per dollar of stablecoins. These estimates vary substantially among stablecoin issuers and across time, based on the volatility of the stablecoins’ prices on the secondary market and the issuers’ balance sheets. Understanding these estimates could be useful to policymakers in evaluating proposals for stablecoin insurance or as a reference point from which to assess possible alternatives. To be clear, this article only discusses a methodology by which a third-party insurer may calculate a theory-based, market-data-driven premium as related to stablecoins. We do not take a position on any other risks that might affect the price of stablecoin insurance, ways that stablecoins and associated risks may differ from traditional commercial bank deposits, or risk-mitigating factors present for traditional bank deposits that affect the price of deposit insurance, such as longstanding stability in federal banking law and federal prudential regulation and supervision.
Section I compares the role of stablecoins in the crypto asset ecosystem to the role of bank deposits in the traditional financial system. Section II introduces a method traditionally used for pricing bank deposit insurance and describes the data we use to estimate the cost of stablecoin insurance. Section III provides estimated costs for four major stablecoin issuers over time and discusses the main drivers of the estimates: the issuers’ capital buffers and price volatility.
I. Comparing Stablecoins with Bank Deposits
Stablecoins are a category of crypto asset intended to maintain a stable value against a reference asset, usually the U.S. dollar. The vast majority of the $130 billion stablecoin industry consists of collateralized stablecoins (our focus here) that are created or “minted” by an issuer and sold to customers in exchange for other assets. In theory, collateralization enables customers to redeem their stablecoins at their “pegged” price—that is, the price of the reference asset—at any time, less any possible fees.
Stablecoins mirror bank deposits in a few key ways. First, stablecoins offer a relatively stable store of value, allowing holders to keep their money in a less volatile asset without needing to withdraw it from the crypto asset ecosystem entirely. Second, stablecoins serve as the primary medium of exchange between crypto assets, offering users a less costly and more convenient method for transacting crypto assets (Gorton and Zhang 2021). As evidence of their use as a medium of exchange, daily stablecoin transaction volumes have approached $1 trillion according to crypto market tracker CoinGecko. Third, stablecoins, like uninsured bank deposits, are susceptible to runs. Multiple stablecoin collapses in recent years mirrored traditional bank runs: stablecoin holders lost confidence that the issuers could credibly meet their obligations to redeem the coins at par and raced to withdraw their funds before they lost value. In traditional finance, the adoption of deposit insurance—a guarantee of the value of deposits in the case of institutional collapse—has dramatically reduced the risk of bank runs. However, crypto assets currently exist outside of the traditional, regulated financial landscape and have no similar safeguard.
Overall, stablecoins and deposits have some similar characteristics and vulnerabilities—if not similar regulatory protections. Indeed, Gorton and others (2022) state that “stablecoins are economically equivalent to deposits.”
II. Pricing Stablecoin Deposit Insurance
To the best of our knowledge, the cost of insuring stablecoins has not been quantitatively investigated, perhaps due to the relative youth of the crypto asset sector. However, decades ago, Merton (1977) showed that the cost of insuring bank deposits can be derived from the standard option pricing formula developed by Black and Scholes (1973), which estimates the value of an option contract using the value and volatility of the underlying asset (among other inputs). Option pricing methods have been widely adopted in the financial industry, and their applications to deposit insurance are well established in banking research.
Deposit or stablecoin insurance can be thought of as a type of option contract between a third-party guarantor and the guaranteed firm (the stablecoin issuer). If a third-party guarantor fully guarantees an issuer’s stablecoins at par, that party would be obligated to pay the issuer’s debt (outstanding stablecoins), net of the issuer’s assets, should the issuer fail. That is, if the value of debt exceeded the value of the issuer’s assets, the guarantor would be required to make up the difference to cover any loss to the debt (stablecoin) holders. This obligation is equivalent to a put option, where the debt level is comparable to the option’s exercise price and the value of assets is comparable to the underlying stock’s price. Under that interpretation, a value can be assigned to the deposit guarantee using standard option pricing methods.
The standard option pricing formula used to estimate the cost of deposit insurance requires three inputs, which represent characteristics of the bank._ The first two inputs, the value of the bank’s assets and the value of its liabilities, allow us to calculate the bank’s capital buffer, which represents how much value the bank’s assets can lose before their value sinks below that of the bank’s liabilities and the bank becomes insolvent. The third input, the volatility of the assets backing the deposits, captures fluctuations in the price of the assets backing the bank’s deposits. Together, these inputs describe how likely the bank is to become insolvent.
The primary challenge of using option pricing techniques to price stablecoin insurance is the availability of these data inputs for stablecoin issuers. Many banks have stock prices that can provide a rich source of information about the market’s view of the underlying risk of the banks’ assets. However, there is no analogous equity market for stablecoin issuers. Further, while banks are required to submit detailed, audited regulatory forms on a quarterly basis, stablecoins are under no such obligation.
Nevertheless, some stablecoin issuers voluntarily release detailed data on their asset holdings and outstanding liabilities. We use data on issuer assets and liabilities hand-collected directly from the self-reported values for four major issuers of collateralized stablecoins (which we anonymize as A, B, C, and D), with which we can calculate an issuer’s capital buffer—that is, its capital divided by assets._ Because we cannot directly observe an issuer’s capital buffer on a daily basis, we take the issuer’s reported capital buffer and extrapolate that level backward in time to the previous report (or the average time between reports for the first report). If, for example, the issuer held a capital buffer of $1 million at the time of the report, we would assume that any changes in liabilities from the previous report increased their assets by the same amount, keeping their capital buffer constant. In effect, this assumes that any additional dollar received by an issuer as a deposit is placed directly in its cash holdings, and therefore adds no additional asset risk. Thus, in terms of changes in asset risk, this extrapolation is conservative.
Compared with other applications of Merton (1977), our method for deriving asset volatility is somewhat unique. By definition, the value of assets equals the sum of the values of equity and liabilities, so the volatility of assets can be observed from the volatility of equity and liabilities. When applying Merton’s method to bank deposits, asset volatility is typically derived indirectly from the price volatility of equity (usually via stock prices). In applying Merton’s method to stablecoin deposits, we observe the price volatility of liabilities instead of the price volatility of equity due to data limitations. Thus, we refer only to asset volatility as derived from the price volatility of liabilities in the discussion of results.
To calculate the volatility of assets, we use publicly available crypto asset trading data. The value of a claim on $1 of an issuer’s assets can be observed by the market price of a single stablecoin for a given issuer. Thus, at least relative to banks, very detailed market-based information is available about the unit price of debt for each stablecoin issuer. With this information, we can estimate the quarterly (90-day) price volatility of liabilities (based on the variance of daily log changes), from which we derive the volatility of assets.
The data we have for stablecoin issuers shows that they differ from banks in at least two ways that will directly affect estimates of the cost of insurance. First, stablecoins incur more balance sheet volatility through changes in the size and price of their debt than banks. Compared with bank deposits, stablecoins experience regular price fluctuations. The value of an issuer’s total deposits can thus vary widely over time, posing additional risk to stablecoin issuers and driving up estimated costs of insurance. Compared with banks, stablecoin issuers also purportedly hold higher proportions of assets that are more liquid and less volatile, such as cash or short-term Treasuries. Stablecoin issuers report holdings of these low credit-risk assets between 80 and 100 percent, which could offset some of the risk posed by other factors.
Second, stablecoin issuers typically hold a much smaller capital buffer, or capital ratio, against potential losses than banks. Chart 1 shows that since 2020, four major stablecoin issuers (labeled A, B, C, and D) typically held capital buffers of between 0 and 6 percent of their total assets. Across time and issuers, the average capital buffer is about 0.9 percent of assets—much less than that of banks, which hold analogous buffers of around 9.5 percent of assets, on average._ Smaller capital buffers increase stablecoin issuers’ risk relative to banks.
Chart 1: Stablecoin Issuer Capital Ratios
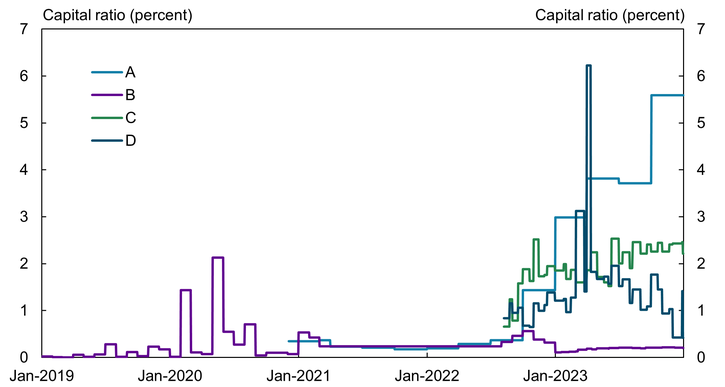
Sources: Public releases by stablecoin issuers and authors’ calculations.
III. Estimates of the Cost of Stablecoin Deposit Insurance
Having calculated the capital buffer and asset volatility, we can plug values into Merton’s deposit insurance pricing model to estimate the price for each stablecoin (see appendix for model details). Chart 2 shows annualized estimates of the quarterly price of insurance for our four major stablecoin issuers, which range from essentially zero to just below $0.13 per dollar insured for 90 days (annualized), depending on time and the issuer. Most recent estimates fall below $0.02 per dollar, with several coins stabilizing lower than this since late 2022.
Chart 2: Estimated Price Per Dollar of 90-Day Guarantee (Annualized)
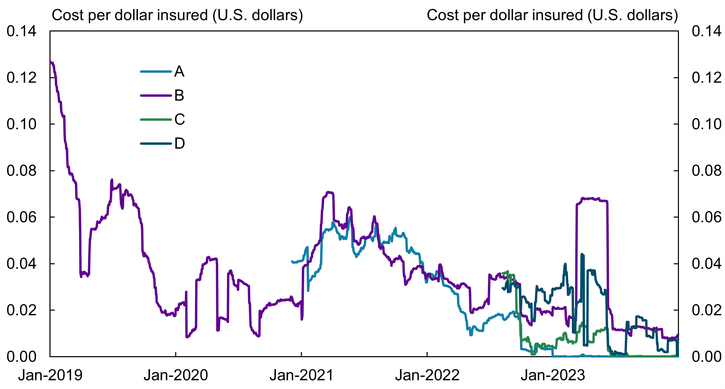
Sources: Public releases by stablecoin issuers and authors’ calculations.
Chart 2 illustrates that the price of the guarantee varies substantially across time and between issuers. More generally, the price appears to depend on the greater financial landscape, spiking for most issuers during the financial turmoil of March 2023. This spike is not surprising, as stablecoin issuers experienced elevated volatility during this time, either through extraordinary fund inflows or outflows, depending on their individual circumstances.
Over time, our price estimates generally trend down for all issuers. For some issuers, the lower estimates are largely due to capital buffers growing over time, attenuating the effects of the increases in asset volatility._ For other issuers, volatility appears to have diminished over time, perhaps due to a stabilization in the stablecoin’s demand.
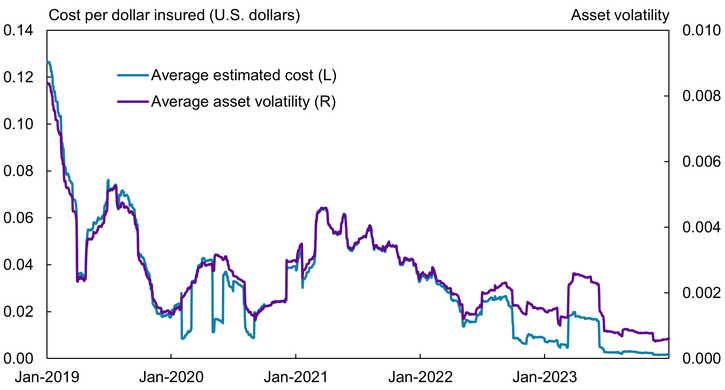
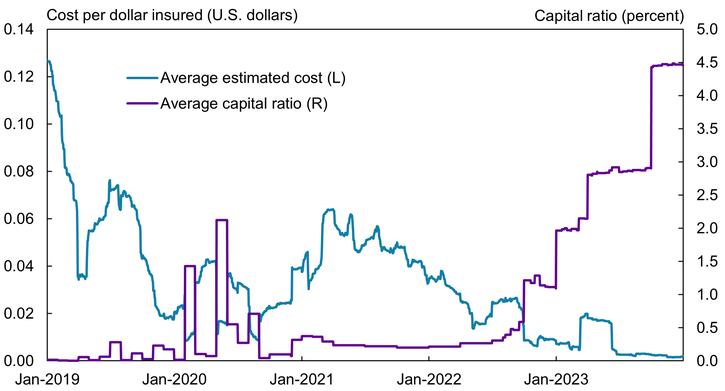
Panels A and B of Chart 3 illustrate the relationship between asset volatility and capital buffers, respectively, on deposit insurance cost estimates. Panel A shows that increases (decreases) in asset volatility (purple line) translate directly to increases (decreases) in the estimated price of insurance (blue line). Panel B shows that higher capital buffers reduce the sensitivity of insurance cost estimates to shifts in asset volatility. Essentially, a larger capital buffer corresponds to a larger shortfall in asset value required for the issuer to become insolvent. As a result, the effects of changes in asset volatility on cost estimates are weakened by an upward-trending average capital ratio (purple line).
Chart 3: Asset Volatility and Capital Buffer Compared with Average Estimated Cost (Annualized)
Panel A: Asset Volatility
Panel B: Capital Buffer
Sources: Public releases by stablecoin issuers and authors’ calculations.
In fact, due to both reduced asset volatility and an increased capital buffer, the fund-weighted average stablecoin issuer’s cost per dollar of insurance has remained under $0.02 per dollar insured since late 2022 for these four stablecoins. For reference, this cost exceeds the range that the FDIC assesses to banks, though we cannot make a direct comparison with available information. When translated to annualized basis points (cents per $100 of assessment base), the average stablecoin issuer’s rate for these four stablecoins is at about 320 basis points, with the FDIC assessing between 2.5 and 42 basis points to banks (FDIC 2023).
Conclusion
Stablecoins have been identified as a possible emerging risk to financial stability. Although stablecoins are relatively new products, they suffer from an old weakness: runs. Financial systems have attempted to mitigate runs in the traditional banking sector with deposit insurance, but stablecoins currently have no such guarantee.
We show that well-established methods can be used to estimate the price of a potential guarantee against stablecoin losses. Specifically, we show that stablecoin insurance can be priced using methods pioneered by Black and Scholes (1973) and Merton (1974, 1977). Under this framework, the cost of stablecoin insurance is determined by an issuer’s asset volatility and their capital cushion. We find that the estimated costs vary across issuer and across time, from nearly zero to just below $0.13 per dollar insured for 90 days (annualized). Since 2020, the estimated insurance cost has generally trended down, as estimated asset volatility has decreased and as issuers have increased the size of their capital cushions.
We apply the most basic iteration of the Merton deposit insurance pricing model for the sake of simplicity, leaving room for future improvements and extensions. Such future work could include alternative methods for estimating asset volatility, alternative distributional assumptions, or one of many other innovations that have been made to the methods of Merton, Black, and Scholes over the decades. Still, if stablecoins become more closely tied to the U.S. financial system, understanding the costs and benefits of different risk-mitigation strategies will be essential to allow policymakers to make informed decisions.
Appendix: The Merton, Black, Scholes Model
Merton (1977) shows that deposit guarantees are equivalent to the guarantor selling a European put option to the firm (in our case, the stablecoin issuer). The deposit guarantee is economically equivalent to the guarantor promising to purchase the issuer’s assets (A) at the value of their debt (D) if the issuer decides to exercise the option on its expiration date, which Merton takes to be the next audit date of the bank’s balance sheet. Because stablecoin issuers are not necessarily audited, we assume a 90-day time horizon to match the frequency at which banks’ deposit insurance costs are assessed. If the value of the issuer’s assets falls below the value of their debt (A < D), then the firm will exercise that option. In effect, the issuer trades their assets to completely pay off their debt. However, because the assets they have are worth less than what they owe (A < D), the guarantor suffers a loss. The debtholders (depositors) are made whole, the issuer is dissolved, and the guarantor experiences a net loss.
Mathematically, from Black and Scholes (1973), the value of the European put option, G, can be expressed as:

where

and

Here, r is the risk-free interest rate (assumed to be zero in our application for simplicity), T is the expiration date, Φ is the normal cumulative distribution function, and σ is the volatility of assets. Annualized estimates are calculated simply by multiplying quarterly estimates by four.
Endnotes
-
1
The formula also has other inputs, namely the risk-free interest rate and the time to expiration.
-
2
Our data for each coin begins with its first release and ends December 31, 2023.
-
3
Here and throughout the paper, we take the average across the coins for which data are available, from one to four coins depending on the date. Further, the average is weighted by each issuer's total reported assets backing the coin.
-
4
Although increased capital buffers may, as a general rule, have the effects we note, various other critical components such as liquidity management, risk management, and a company’s overall business plan could greatly affect pricing but are outside the scope of this article.
Publication information: Vol. 109, no. 4
DOI: 10.18651/ER/v109n4JacewitzAcker
References
Black, Fischer, and Myron Scholes. 1973. “The Pricing of Options and Corporate Liabilities.” Journal of Political Economy, vol. 81, no. 3, pp. 637–654. Available at External Linkhttps://doi.org/10.1086/260062
Board of Governors of the Federal Reserve System. 2024. “Annual Bank Capital Requirements.”
FDIC (Federal Deposit Insurance Corporation). 2023. “Deposit Insurance Assessments: FDIC Assessment Rates.” Last updated January 30, 2023.
FSOC (Financial Stability Oversight Council). 2022. “Report on Digital Asset Financial Stability Risks and Regulation, 2022.”
Gorton, Gary B., Elizabeth C. Klee, Chase P. Ross, Sharon Y. Ross, and Alexandros P. Vardoulakis. 2022. “Leverage and Stablecoin Pegs.” National Bureau of Economic Research, working paper no. 30796, December. Available at External Linkhttps://doi.org/10.3386/w30796
Gorton, Gary B., and Jeffery Y. Zhang. 2023. “Taming Wildcat Stablecoins.” University of Chicago Law Review, vol. 90, no. 3, pp. 909–971.
Johnson, Katanga. 2023. “Fed’s Barr Sees Stability Risk in Private Crypto Stablecoins.” Bloomberg, November 7.
Kiernan, Paul. 2022. “Yellen Renews Call for Stablecoin Regulation after TerraUSD Stumble.” Wall Street Journal, May 10.
Kim, Sang Rae. 2022. “How the Cryptocurrency Market Is Connected to the Financial Market.” SSRN, May 13. Available at External Linkhttps://doi.org/10.2139/ssrn.4106815
Merton, Robert C. 1977. “An Analytic Derivation of the Cost of Deposit Insurance and Loan Guarantees: An Application of Modern Option Pricing Theory.” Journal of Banking & Finance, vol. 1, no. 1, pp. 3–11. Available at External Linkhttps://doi.org/10.1016/0378-4266(77)90015-2
———. 1974. “On the Pricing of Corporate Debt: The Risk Structure of Interest Rates.” Journal of Finance, vol. 29, no. 2, pp. 449–470. Available at External Linkhttps://doi.org/10.1111/j.1540-6261.1974.tb03058.x