Although banks and nonbanks both provide mortgage loans, they operate in fundamentally different ways that could affect how they respond to changes in interest rates. Since the Federal Reserve began tightening monetary policy in March 2022, nonbanks have lost considerable market share to banks, suggesting that higher interest rates may benefit bank over nonbank business models.
In this article, Jordan Pandolfo, Chris Acker, and Phillip An examine differences between the business models of banks and nonbanks to explain how the level of interest rates affects their respective market shares. They identify three fundamental differences in these lenders’ business models: funding, balance sheet lending, and capacity. First, they demonstrate that banks’ cost of funding is lower than nonbanks’ during periods of high interest rates. Second, they show that banks depend less on the mortgage-backed securities market, which is less profitable when interest rates are high. Third, they find that while nonbanks can process mortgage applications more quickly than banks when interest rates are low, they lose this advantage when interest rates rise. Together, these three factors explain how banks gain market share during periods of high interest rates and, correspondingly, lose market share during periods of low interest rates.
Introduction
In the U.S. mortgage market, both banks and nonbanks provide mortgage loans. However, these two types of lenders operate in fundamentally different ways that could affect how they respond to changes in monetary policy and interest rates. For example, since the Federal Reserve began tightening monetary policy in March 2022, nonbanks have lost considerable market share to banks. This loss in market share suggests that higher interest rates could benefit bank over nonbank business models.
This article examines differences between the business models of banks and nonbanks to explain how the level of interest rates affects their respective market shares. We identify three fundamental differences in these lenders’ business models: funding, balance sheet lending, and capacity. First, we demonstrate that banks’ cost of funding is lower than nonbanks’ during periods of high interest rates. Second, we show that banks depend less on the mortgage-backed securities (MBS) market, which is less profitable when interest rates are high. Third, we find that while nonbanks are able to process mortgage applications more quickly than banks when interest rates are low, they lose this advantage when interest rates rise. Together, these three factors explain how banks gain market share during periods of high interest rates and, correspondingly, lose market share during periods of low interest rates.
Our results suggest that banks and nonbanks may react differently to central bank decisions to raise (or lower) the level of rates. Specifically, given nonbanks’ reliance on market funding and the MBS market, our analysis suggests nonbanks may exhibit more sensitivity to changes in monetary policy.
Section I provides an overview of the U.S. mortgage market. Section II documents trends in market share over 2019–23, a period characterized by significant changes in the level of interest rates. Section III identifies three factors that help explain the negative relationship between nonbank market shares and interest rates.
I. An Overview of the U.S. Mortgage Market
As lenders, banks and nonbanks play the same role in mortgage intermediation. Figure 1 depicts a stylized chain of intermediation for a conforming mortgage in the U.S. market._ When a mortgage is originated, the lender (bank or nonbank) provides a home buyer with cash and receives a mortgage liability—that is, a promise from the buyer to make a series of mortgage payments at a determined rate. The lender usually borrows to provide cash to the home buyer. For example, a bank may use its deposits to fund a mortgage.
Figure 1: Mortgage Intermediation Chain
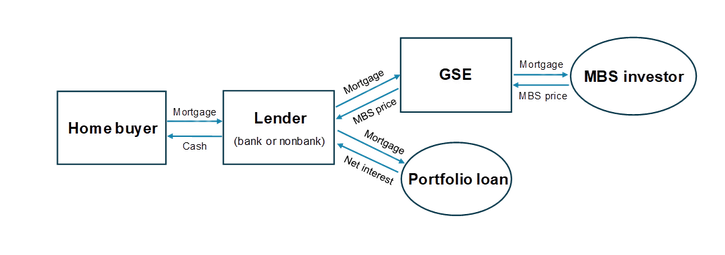
Once the mortgage is originated, the lender has two options: keep the mortgage on its balance sheet as a portfolio loan or securitize the mortgage through a government-sponsored enterprise (GSE)._ If the lender keeps the mortgage as a portfolio loan, it profits from the net interest payments (mortgage payments less the cost of borrowed funds) throughout the life of the loan. If the lender chooses to securitize the mortgage, it sells the mortgage to a GSE and uses the proceeds to pay off its debt, keeping the remainder as a profit. The GSEs, in turn, act as pass-through entities that bundle many mortgages into a mortgage-backed security (MBS) that is then sold to external MBS investors. Thus, the price that lenders receive is, in large part, determined by the demand of MBS investors such as money market mutual funds.
Although portfolio loans allow lenders to receive all the net interest payments from mortgages, they also come with risks: specifically, prepayment, default, or interest rate risk. Prepayment risk refers to the risk that the mortgage will be refinanced before it reaches its contracted maturity of 30 years. Default risk refers to the risk that a home buyer will be unable to make timely payments and thus default on the mortgage. Finally, interest rate risk refers to risk that the value of the mortgage will change due to changes in interest rates. For example, a fixed rate mortgage with a 3 percent rate becomes less valuable for the bank when market rates increase to 6 percent. Mortgage lenders seeking to offload these risks may thus pursue securitization, which allows them to receive an upfront payment for the mortgage. In practice, most conforming loans are securitized. For example, between 2018 and 2023, 80 percent of all conforming mortgages were securitized.
Historically, most conforming mortgages have been originated by banks. Chart 1 shows that from 1990 to 2020, banks originated the majority of conforming mortgage loans (purple area). Banks are chartered, deposit-taking institutions such as commercial banks, thrifts, or credit unions._ Banks can collect deposits, have access to special liquidity facilities, and are subject to a unique set of regulations.
Chart 1: Loan Volume in U.S. Conforming Mortgage Market: Bank and Nonbank
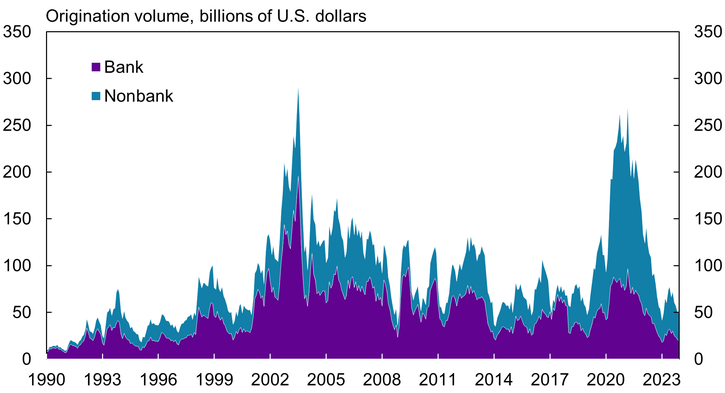
Source: Home Mortgage Disclosure Act (HMDA) data from the Consumer Financial Protection Bureau (CFPB).
Over the last 30 years, however, the volume of mortgage loans originated by nonbanks has increased (blue area in Chart 1). Nonbanks are non-depository institutions that cannot collect insured deposits and are regulated by a different set of agencies._ Growth in nonbanks’ loan origination has commonly been attributed to their faster adoption of technology as well as the increased regulatory burden for banks (Buchak and others 2018; Bartlett and others 2022; Calem, Correa, and Lee 2020). In fact, the nonbank market share of the U.S. mortgage market has grown from just 20 percent in 1990 to more than 65 percent in 2020.
II. Trends in Market Share from the Recent Rate Cycle
Mortgage lenders are significantly affected by changes in short-term interest rates, as they often borrow in the short term to originate a long-term mortgage. Thus, monetary policy can jointly affect both a lender’s borrowing costs and mortgage pricing.
In the United States, the Federal Reserve lowered the federal funds rate over the 2019–21 period and increased the federal funds rate in 2022–23. Chart 2 shows that during the 2019–21 easing period, the 10-year Treasury rate—a proxy for the level of interest rates—fell by 209 basis points from peak to trough (purple line), and the nonbank market share increased by nearly 20 percentage points (blue line)._ Conversely, in the 2022–23 tightening period, the 10-year Treasury rate increased by 304 basis points from trough to peak, and the nonbank market share fell by more than 10 percentage points. Thus, in the recent rate cycle, nonbanks gained considerable market share when rates were falling but lost much of that share when rates were rising.
Chart 2: Nonbank Share of U.S. Conforming Mortgage Market and the 10-Year Treasury Rate: 1990–2023
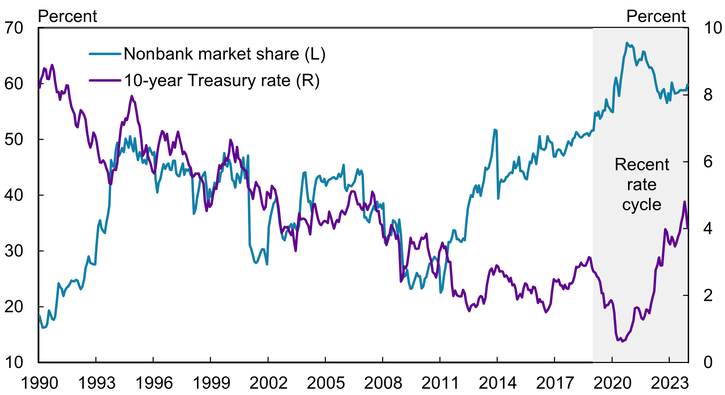
Sources: HMDA (CFPB) and FRED (Federal Reserve Bank of St. Louis).
Overall, Chart 2 shows that the correlation between nonbank market share and interest rates is strong and negative—that is, the nonbank market share moves in the opposite direction of interest rates. However, it is important to note that changes in the level of interest rates can occur for a variety of reasons other than monetary policy, such as economic growth, inflation, or government borrowing. Thus, we cannot attribute the cyclical behavior of the nonbank market share to monetary policy alone.
III. Relevant Factors Affecting Market Share
Why do bank and nonbank market shares shift when the level of interest rates changes? Although banks and nonbanks both provide standardized mortgage loans and compete for the same set of consumers, they operate with fundamentally different costs, technologies, and constraints. Differences in bank and nonbank funding, balance sheet lending, and capacity in particular may help explain the link between interest rates and market share for bank and nonbanks.
Bank funding advantage when interest rates are high
Deposits represent a key source of profitability for banks (Egan, Lewellen, and Sunderam 2022). Banks provide services to depositors, which in conjunction with deposit insurance make deposits an attractive place for savers to park their cash. Deposits, in turn, serve as a stable and cheap source of funding for banks because depositors are willing to accept a lower return and switch accounts infrequently.
How lucrative deposits are as a source of funding depends on the deposit spread: the difference between a benchmark funding rate and the bank’s deposit rate. In a perfectly competitive environment where banks cannot profit from deposits, we would expect the funding rate and deposit rate to be the same and the deposit spread to be zero. In practice, however, Drechsler, Savov, and Schnabl (2017) have documented a positive deposit spread, which increases with the level of interest rates. In other words, as interest rates rise, banks earn a greater share of interest on their loans relative to the interest they pay on deposits, incentivizing loan origination.
This phenomenon of cheaper debt for banks in a higher interest rate environment can be seen in the recent rate cycle, shown in Chart 3. Here, the deposit spread is measured as the difference between the financial commercial paper rate and the average bank rate for certificates of deposits._ When the level of rates was low in 2020–21, the deposit spread (purple line) was near zero, suggesting banks had little funding advantage; that is, their debt was just as expensive as nonbanks’ debt. However, when the level of rates rose in 2022–23, the deposit spread increased, and banks were able to borrow at a relatively lower rate.
Chart 3: Nonbank Share of U.S. Conforming Mortgage Market and Bank Deposit Spreads: 2018–23
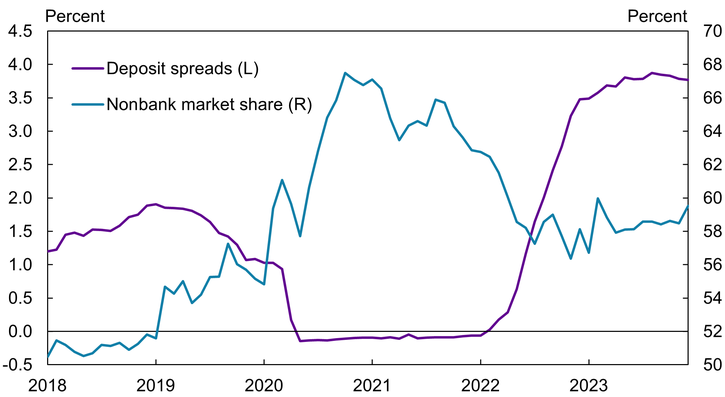
Sources: HMDA (CFPB), Board of Governors of the Federal Reserve System, and S&P Capital IQ.
Chart 3 also shows that nonbanks’ market share (blue line) fell in 2022 as deposit spreads climbed. In contrast to banks, nonbanks are unable to issue deposits and thus do not benefit from a positive deposit spread. Instead, nonbanks must fund their mortgage originations through more rate-sensitive market funding, such as commercial paper. We call this difference between banks and nonbanks the bank funding advantage: When interest rates rise, the cost of borrowing for banks becomes relatively cheaper, increasing their profitability and allowing them to gain market share.
To further illustrate how the bank funding advantage may increase bank market share, Chart 4 plots the average transacted mortgage rate by nonbanks and banks from 2018 to 2023. Although these rates are similar in the pre-2022 sample period, a noticeable gap opens at the start of the 2022–23 tightening period. In this period, bank mortgage rates (purple line) were, on average, 0.3 percent lower than nonbank mortgage rates (blue line), with the gap as large as 0.6 percent in 2022._ Lower bank funding costs—and, accordingly, more competitive bank mortgage rates—may partly explain this result.
Chart 4: Average Mortgage Rate for Banks and Nonbanks: 2018–23
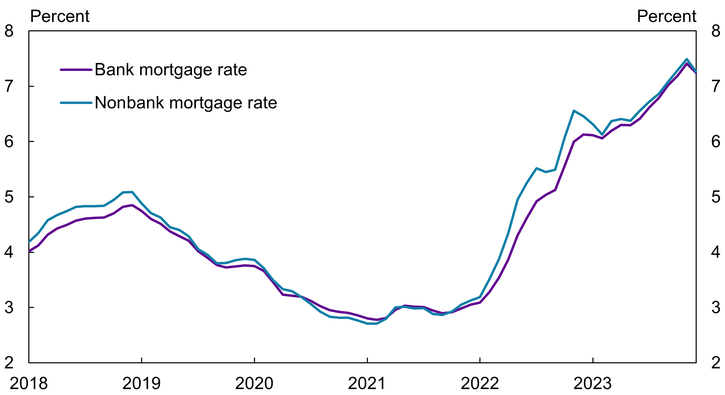
Source: HMDA (CFPB).
Bank balance sheet advantage when interest rates are high
Banks and nonbanks also differ in their decisions regarding whether to sell their mortgages or keep them on their balance sheets as portfolio loans. Although both bank and nonbank mortgage lenders have the option to keep mortgages on their balance sheets, the nonbank business model is designed such that nonbanks sell virtually all of their mortgages to be packaged into MBS, a practice known as originate-to-distribute. Nonbanks often rely on credit lines as a funding mechanism for loan originations, which are a more expensive form of debt funding compared with bank deposits. Because portfolio lending is less profitable for nonbanks, originate-to-distribute is effectively their only option. Indeed, over the 2018–23 period, nonbanks sold more than 95 percent of their mortgages. Although this business model allows nonbanks to be less dependent on their balance sheet and funding costs, it also creates a new dependency on the price at which investors are willing to buy MBS.
To illustrate this point, we construct a time-varying measure of a lender’s net proceeds from selling a mortgage in the agency MBS market. This measure is based on observable mortgage rates and MBS prices throughout the 2018–23 sample period._ This measure can be interpreted as the payment net of principal (in percentage points) that a lender would receive from selling their mortgage. For example, if a mortgage lender borrows $100,000 to originate a mortgage and sold it when the MBS return was 2 percent, the lender would receive $102,000. The lender would then have a remaining $2,000 (or 2 percent of principal) to pay any interest expense or operational expense. Any amount leftover would represent the lender’s profit.
Chart 5 shows that during the 2022–23 tightening period, the net proceeds for lenders selling mortgages declined by approximately 4 percentage points (purple line). Accordingly, bank securitization rates declined by almost 30 percentage points (blue line), as banks found it more profitable to hold portfolio loans than sell. In contrast, nonbank securitization rates remained constant at 94 percent over the same period._ Although the profitability of the originate-to-distribute business model declined significantly, nonbanks had no place else to go. We refer to this additional degree of freedom for banks as the balance sheet advantage: When the returns from selling mortgages in the MBS market are low banks can switch to portfolio lending, while nonbanks cannot._
Chart 5: MBS Returns and Bank Securitization Rates
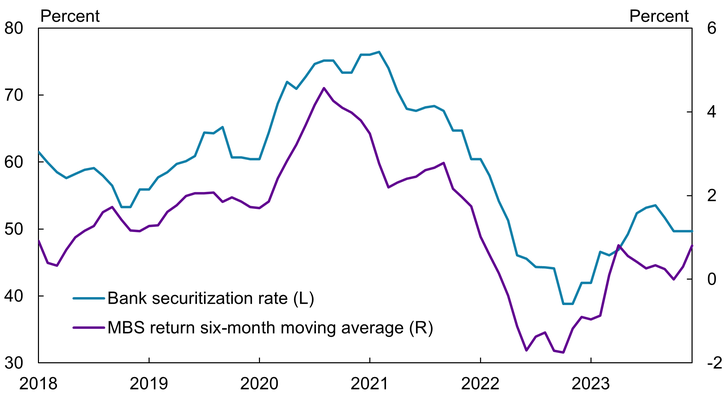
Sources: HMDA (CFPB) and Bloomberg.
Bank capacity disadvantage when interest rates are low
Although banks appear to have both a funding and balance sheet advantage, some evidence suggests banks may be subject to more constraints than nonbanks, limiting their ability to scale up loan origination in a timely manner. For example, relative to their nonbank counterparts, banks had difficulty keeping up with loan demand during the 2020 mortgage refinance boom (Fuster and others 2021). Buchak and others (2018) and Shoemaker (2019) suggest banks’ use of older legacy IT systems may limit their capacity relative to nonbanks, which tend to be newer entrants with newer technology. Other possible reasons for banks’ capacity constraints include greater regulatory compliance and more stringent internal controls.
We proxy for capacity constraints by plotting the difference in average loan processing time for banks relative to nonbanks. A positive number implies nonbanks process mortgage applications more quickly and face fewer capacity constraints in providing mortgage credit. Chart 6 shows that banks process mortgage applications more slowly than their nonbank counterparts by an average of 6.5 days (purple line). This difference in processing time varies over the business cycle: During the 2020–21 easing period of low rates, nonbanks had an even greater edge, processing mortgage applications 14 days faster than banks. Conversely, during the 2022–23 tightening period of higher interest rates, the processing time gap narrowed, suggesting banks were not as constrained.
Chart 6: Nonbank Share of U.S. Conforming Mortgage Market and Mortgage Application Processing Time Difference: 2018–23
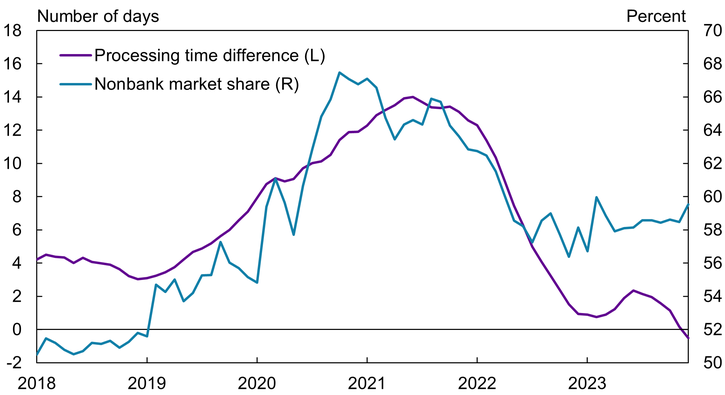
Notes: The purple line plots the difference in average loan processing time for banks relative to nonbanks. A positive number implies that nonbanks process mortgage applications more quickly.
Source: HMDA (CFPB).
Chart 6 also reveals a strong positive correlation between the difference in processing time and nonbank market share (blue line). We refer to the cyclical variation in processing time differences as the bank capacity disadvantage. Intuitively, when banks are unable to quickly process applications, mortgage applicants are more likely to accept faster offers from nonbanks or simply choose not to interact with banks in the first place. This relationship appears the most pronounced during periods of low interest rates and corresponds precisely to periods of high loan activity, when homeowners try to take advantage of attractive rates. However, during periods of higher rates, when mortgage demand is low, nonbanks lose their processing advantage over banks, which may contribute to nonbanks’ loss of market share.
Decomposition exercise
All three of our identified factors help explain why banks may gain mortgage market share when interest rates are high and lose market share when rates are low. Many other factors can influence nonbank market shares over time, but our three factors jointly explain half of the variation we observe for the 2018–23 period._
Although this result demonstrates that our factors have substantial explanatory power, it does not reveal the relative importance of each factor in determining the market share of nonbanks and banks as the interest rates change. To that end, we employ a statistical exercise that measures how much each factor contributes to the explainable variation in nonbanks’ market share._ We further make a distinction between refinanced mortgage loans (refis) and new home purchases, as loan characteristics differ substantially between these types of loans.
Chart 7 shows the contribution of each factor to explaining nonbank market shares over the 2018–23 sample period, partitioned into the market for refis and new home purchases. For the new purchases market (purple bars), almost 70 percent of the variation in nonbank market shares can be explained by differences in processing time, or capacity. This result implies that the relative speed and efficiency with which nonbanks process and supply mortgage credit is of first-order importance in determining their market share.
Chart 7: Contributions to Nonbank Share of U.S. Conforming Mortgage Market, 2018–23
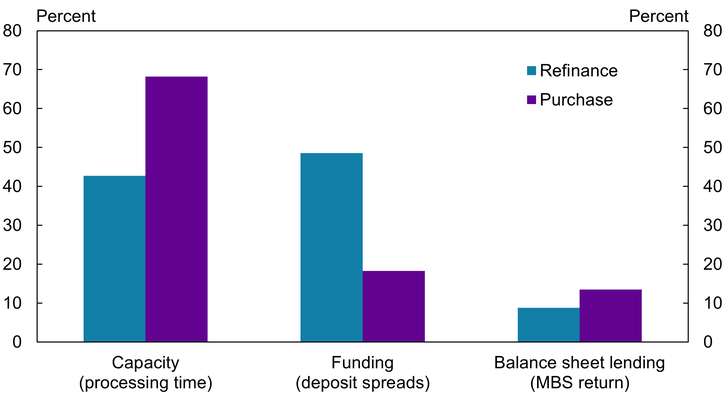
Source: HMDA (CFPB).
Our results differ for the refi mortgage market (blue bars). Funding (specifically, differences in banks and nonbanks’ ability to leverage deposit spreads) is the dominant factor, explaining more than 50 percent of the variation in nonbank market share. This result is consistent with the operational demands of a refi compared with a new purchase: Mortgage applications for a new purchase are more labor- and screening-intensive, such that processing times play an outsized role. Thus, for a less screening-intensive refi mortgage, funding costs and interest margins logically become more important factors affecting market share.
Conclusion
To the extent that banks and nonbanks operate with a different technology or set of constraints, they are likely to respond differently to economic shocks, with implications for the supply of mortgages and other credit products. For example, during the COVID-19 pandemic, demand for online services increased significantly. For banks that operationally relied more on in-person branch services, this shift signified a large and negative demand shock. Conversely, many nonbanks were already completely virtual in their staff operations and applications process and therefore better able to respond to the shock. In this way, the composition of lenders can influence how a shock transmits through the banking system.
We find that the composition of lenders, as measured by market shares, does vary over time and with the level of interest rates. In fact, bank market shares tend to increase when interest rates are high. Operational differences such as funding sources, balance sheet utilization, and processing times are important determinants that help explain this phenomenon.
During the recent 2022–23 tightening cycle, banks originated mortgages at lower rates compared with nonbanks. In the context of monetary policy, our findings suggest that nonbanks exhibit higher pass-through of rates: nonbanks are more likely to move their mortgage rates one-for-one with other market rates or the monetary policy rate. Thus, in a mortgage market dominated by nonbank lenders, we may expect higher rate pass-through and more variation in total mortgage credit throughout the rate cycle.
Endnotes
-
1
We restrict our sample to the conforming loan market—mortgages that satisfy specific standards set by government-sponsored enterprises (GSEs). Conforming loans are of high credit quality and make up the largest segment of the market. We call this example stylized because the mortgage intermediation chain can often involve additional layers (such as more counterparties) and more complicated decisions made by home buyers and originators.
-
2
GSEs (such as Fannie Mae or Freddie Mac) are financial services corporations created by the U.S. Congress that enhance the available supply of credit to the mortgage market by purchasing mortgages and reducing the risk of capital losses for investors.
-
3
Bank charters are granted by a set of government institutions including the Federal Deposit Insurance Corporation (FDIC), Office of the Comptroller of the Currency (OCC), National Credit Union Administration (NCUA) and state banking authorities.
-
4
To identify nonbanks in the sample, we use Bob Avery’s HMDA lender files. These files identify nonbank lenders from their reported filing type from 1990 to 2021. We identify nonbank lenders after 2021 based on whether they were reported as a nonbank in prior years or whether they were regulated by the Department of Housing and Urban Development (HUD).
-
5
We use the 10-year Treasury rate, rather than the federal funds rate, as a proxy for the level of interest rates, as the 10-year Treasury rate is a common benchmark for the mortgage market. The 10-year Treasury rate is considered a risk-free rate with a similar maturity to mortgages: While most mortgages in our sample are 30-year fixed-rate mortgages, they often pre-pay at much earlier terms.
-
6
We use the financial commercial paper rate as a proxy for the cost of nonbank funding. In practice, nonbanks use lines of credit to fund their mortgage originations (Jiang 2023). However, those rates are unobservable or unavailable, so we proxy for them with the commercial paper rate. Because the rate spread is based upon offered rates, we can interpret this series as the marginal cost of additional debt funding.
-
7
We control for selection bias by repeating this analysis on a subset of the conforming mortgage market, controlling for borrower credit score, LTV ratios, and DTI ratios. The results still hold.
-
8
Specifically, we compute the average monthly mortgage rate in our sample and derive the implied coupon rate that MBS investors would receive. The coupon rate is mortgage rate minus various fees which are charged by the GSEs and mortgage servicers. We combine the monthly coupon rate with average monthly MBS prices, at different posted coupon rates, to interpolate the average price a bank would receive relative to the par amount.
-
9
The HMDA data record whether each mortgage was securitized in the year in which it was originated; accordingly, these data underreport the securitization of loans originated late in the year. We address this underreporting by carrying forward October securitization rates to November and backfilling January securitization rates to December.
-
10
When interest rates are high, mortgage lenders and MBS investors are both negatively affected by increased loan risks, such as prepayment risk, which makes holding a mortgage in the form of a portfolio loan or as MBS less profitable. The fact that banks choose to hold more portfolio loans during periods of high interest rates suggests that MBS investors are more adversely affected by the risks.
-
11
This explanatory power is measured through a linear multivariate regression of nonbank market share on the deposit spread, MBS return, and the difference in mortgage processing times, which proxy for the bank funding advantage, bank balance sheet advantage, and bank capacity disadvantage, respectively.
-
12
Specifically, we use the Shapley Value method which measures the coefficient of variation (R-squared) across all the combinations of the factors in a multivariate least squares regression framework and delivers a measure of each factor’s marginal contribution to the explainable variation in nonbank market shares.
Publication information: Vol. 110, no. 1
DOI: 10.18651/ER/v110n1PandolfoAckerAn
References
Bartlett, Robert, Adair Morse, Richard Stanton, and Nancy Wallace. 2022. “Consumer-Lending Discrimination in the FinTech Era.” Journal of Financial Economics, vol. 143, no. 1, pp. 30–56. Available at External Linkhttps://doi.org/10.1016/j.jfineco.2021.05.047
Buchak, Greg, Gregor Matvos, Tomasz Piskorski, and Amit Seru. 2018. “Fintech, Regulatory Arbitrage, and the Rise of Shadow Banks.” Journal of Financial Economics, vol. 130, no. 3, pp. 453–483. Available at External Linkhttps://doi.org/10.1016/j.jfineco.2018.03.011
Calem, Paul, Ricardo Correa, and Seung Jung Lee. 2020. “Prudential Policies and Their Impact on Credit in the United States.” Journal of Financial Intermediation, vol. 42, April. Available at External Linkhttps://doi.org/10.1016/j.jfi.2019.04.002
Drechsler, Itamar, Alexi Savov, and Phillip Schnabl. 2017. “The Deposits Channel of Monetary Policy.” Quarterly Journal of Economics, vol. 132, no. 4, pp. 1819–1876. Available at External Linkhttps://doi.org/10.1093/qje/qjx019
Drechsler, Itamar, Alexi Savov, Phillip Schnabl, and Dominik Supera. 2024. “Monetary Policy and the Mortgage Market.” Presented at the Federal Reserve Bank of Kansas City’s Jackson Hole Economic Symposium, Jackson Hole, WY, August 22–24.
Egan, Mark, Stefan Lewellen, and Adi Sunderam. 2022. “The Cross-Section of Bank Value.” Review of Financial Studies, vol. 35, no. 5, pp. 2101–2143. Available at External Linkhttps://doi.org/10.1093/rfs/hhab089
Fuster, Andreas, Aurel Hizmo, Lauren Lambie-Hanson, James Vickery, and Paul Willen. 2021. “How Resilient Is the Mortgage Credit Supply? Evidence from the COVID-19 Pandemic.” National Bureau of Economic Research, working paper no. 28843, May. Available at External Linkhttps://doi.org/10.3386/w28843
Jiang, Erica Xuewei. 2023. “Financing Competitors: Shadow Banks’ Funding and Mortgage Market Competition.” Review of Financial Studies, vol. 36, no. 10, pp. 3861–3905. Available at External Linkhttps://doi.org/10.1093/rfs/hhad031
Shoemaker, Kayla. 2019. “Trends in Mortgage Origination and Servicing: Nonbanks in the Post-Crisis Period.” FDIC Quarterly, vol. 13, no. 4, pp. 51–69.