First quarter energy survey results revealed that Tenth District energy activity increased slightly, and expectations remained expansionary. Firms reported that oil prices needed to be on average $65 per barrel for drilling to be profitable, and $85 per barrel for a substantial increase in drilling to occur. Natural gas prices needed to be $3.80 per million Btu for drilling to be profitable on average, and $5.10 per million Btu for drilling to increase substantially.
Summary of Quarterly Indicators
Tenth District energy activity increased slightly in the first quarter of 2025, as indicated by firms contacted between March 17th, 2025, and March 31st, 2025 (Tables 1 & 2). The quarter-over-quarter drilling and business activity index was 6 in Q1, up from -13 in Q4 (Chart 1). Employment levels and employee hours increased moderately. Despite the increased activity, revenues and profits still declined, each with readings of -9.
Drilling activity remains lower than this time last year, with the year-over-year drilling/business activity index decreasing from -16 to -18 in Q1. Revenues and profits also fell over the year, and capital expenditures decreased moderately at a reading of -9.
Firms’ expectations for future activity rose in Q1, from 13 to 21. Six-month expectations indexes for revenues and profits turned positive in Q1 and increased for capital expenditures. However, future employment is expected to rise only modestly.
Chart 1. Drilling/Business Activity Indexes
Skip to data visualization table| Quarter | Vs. a Quarter Ago | Vs. a Year Ago |
|---|---|---|
| Q1 21 | 35 | 12 |
| Q2 21 | 33 | 59 |
| Q3 21 | 43 | 68 |
| Q4 21 | 32 | 74 |
| Q1 22 | 29 | 52 |
| Q2 22 | 57 | 77 |
| Q3 22 | 44 | 78 |
| Q4 22 | 6 | 56 |
| Q1 23 | -13 | 17 |
| Q2 23 | -19 | -16 |
| Q3 23 | -13 | -23 |
| Q4 23 | -33 | -33 |
| Q1 24 | -13 | -26 |
| Q2 24 | -14 | -25 |
| Q3 24 | -13 | -29 |
| Q4 24 | -13 | -16 |
| Q1 25 | 6 | -18 |
Summary of Special Questions
Firms were asked what oil and natural gas prices were needed on average for drilling to be profitable across the fields in which they are active. The average oil price needed was $65 per barrel (Chart 2), while the average natural gas price needed was $3.80 per million Btu (Chart 3). Firms were also asked what prices were needed for a substantial increase in drilling to occur across the fields in which they are active. The average oil price needed was $85 per barrel (Chart 2), and the average natural gas price needed was $5.10 per million Btu (Chart 3).
Firms reported what they expected oil and natural gas prices to be in six months, one year, two years, and five years. The average expected WTI prices were $67, $69, $72, and $79 per barrel, respectively. The average expected Henry Hub natural gas prices were $3.73, $3.95, $4.23, and $4.78 per million Btu, respectively.
Firms were asked how they believe recent trade policy changes will affect their costs and demand/revenues over the next year (Chart 4). Most firms (62%) believe recent policy changes will increase costs over the next year, but expectations for demand/revenues are mixed. 44% of firms believe the changes will decrease demand, 38% believe they will not change demand, and 18% believe they will increase demand.
Contacts were also asked if they anticipate the share of their inputs/products sourced outside the U.S. to change one year from now and three years from now (Chart 5). 36% of firms anticipate the share of foreign-sourced products to decrease slightly in one year, 46% expect no change, 15% anticipate a slight increase, and 3% expect a significant increase. Additionally, 9% of firms expect their share of foreign-sourced products to decrease significantly in three years, 38% each expect it to decrease slightly and stay steady, 12% anticipate a slight increase, and 3% expect a significant increase.
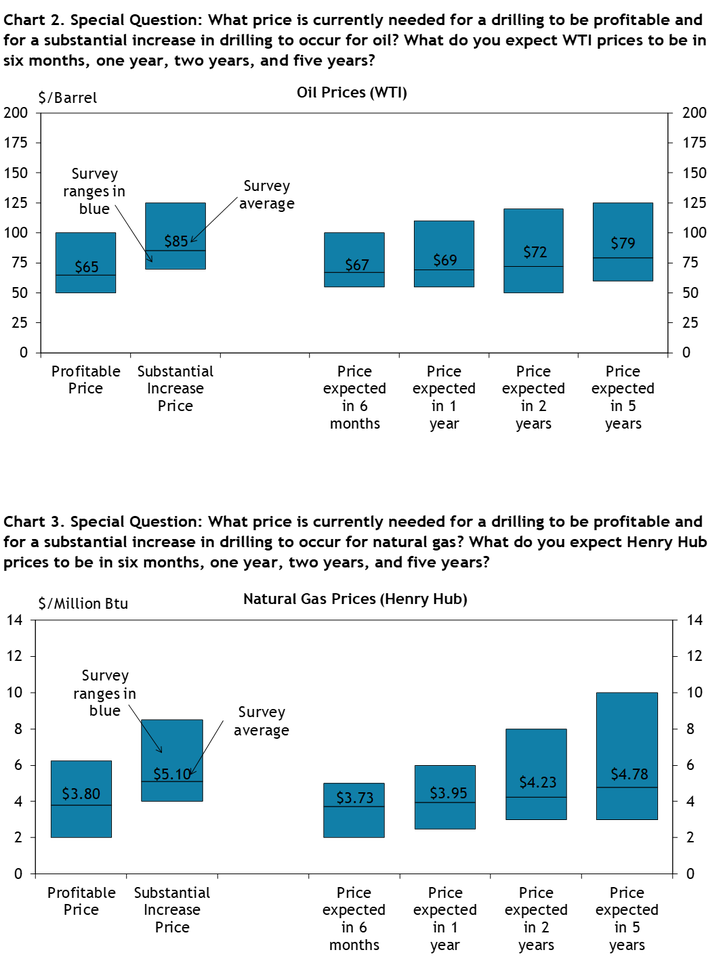
Chart 4. Special Question: How do you believe recent trade policy changes will affect costs and demand/revenues for your business over the next year?
Skip to data visualization table| Category | Costs | Demand/Revenues |
|---|---|---|
| Significantly Lower | 3 | 0 |
| Lower | 17 | 44 |
| No Change | 15 | 38 |
| Higher | 62 | 15 |
| Significantly Higher | 3 | 3 |
Chart 5. Special Question: Do you anticipate the share of inputs/products that you source from outside of the United States to increase, decrease, or stay the same in the future (one year from now and three years from now)?
Skip to data visualization table| Category | One year from now | Three years from now |
|---|---|---|
| Decrease Significantly | 0 | 9 |
| Decrease Slightly | 36 | 38 |
| No Change | 46 | 38 |
| Increase Slightly | 15 | 12 |
| Increase Significantly | 3 | 3 |
| Category | One year from now | Three years from now |


Selected Energy Comments
“Lots of uncertainty on tariffs and overall economy.”
“Manufacturing capacity takes years to put online. No choices currently for large diameter pipe.”
“It is great to finally see some strength in the natural gas market.”
“Fundamentals don't seem to affect the prices like they once did, little regard for storage numbers or lack of new discoveries.”
“Slowing demand due to slowing economy and flattening of production growth driven by lower unit sales prices and increasing cost of supply.”
“Softening of the economy in near term leads to lower energy prices.”
“High demand and inflation pushing up development costs.”
“Increase in electricity demand will require more natural gas.”
“Growing base load power demand and increasing LNG export capacity. Reduced oil growth will reduce associated gas supply to support price.”
“Production growth matching new demand from LNG and electric generation. If supply response to higher pricing outpaces current expectations, we will see some weakness.”
“Production of dissociated natural gas in West Texas and NM will continue to keep natural gas rig count suppressed.”