The economy has been slow to recover the jobs lost early in the COVID-19 pandemic. Low-to-moderate income (LMI) populations have not seen their jobs return nearly as fast as others. Many of the strong economic supports provided by the CARES Act, such as expanded unemployment insurance, have expired. The struggles among LMI populations are evident in the results of the Fourth Quarter LMI Survey the Federal Reserve Bank of Kansas City conducted Nov. 9-20. The survey collects information from nonprofits and other agencies that serve the LMI community in the states of the Federal Reserve’s Tenth District: Colorado, Kansas, western Missouri, Nebraska, northern New Mexico, Oklahoma and Wyoming.
Recipients of the LMI survey received many surveys throughout 2020 as part of an effort to track how the pandemic was affecting LMI communities nationally. Due to survey fatigue and trying to respond to increased demand for services, the survey response rate dropped sharply. As such, the magnitude of the trends identified may not be reliable. However, the trends follow expectations based on other data. This report focuses more on the trends seen through the survey analysis. To supplement this report, the responses from the Tenth District to the National COVID Survey conducted by the Federal Reserve System also are included. The national survey went to the same nonprofits and other agencies in the Tenth District as the LMI survey and was conducted in April, June, August and October. All the index values from the LMI Survey are presented in Appendix 1.
Overall Economic Conditions
Overall economic conditions for LMI populations continued a downward trend in November (Chart 1). An index value less than 100 reflects more respondents saying conditions worsened compared with the reference period. While the index value was better relative to last quarter, conditions still were worsening. Much of the improvement relative to last quarter was related to jobs. Comments suggested that the slow recovery of jobs, rising COVID cases, and lack of movement on a new federal aid package was not giving them confidence for the future. Their lack of confidence for the future was reflected by the worsening conditions they expect next quarter.
Chart 1: Overall LMI Economic Conditions Continued to Worsen
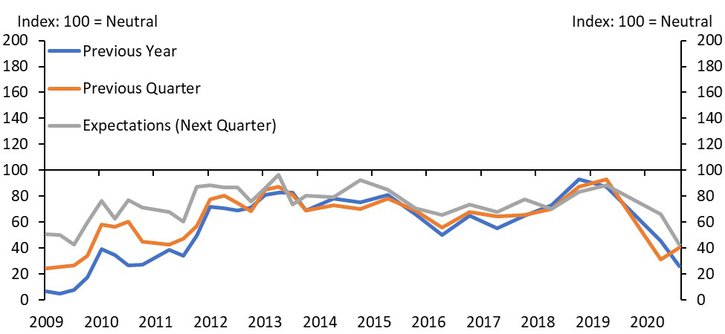
Source: Federal Reserve Bank of Kansas City LMI Survey.
Note: The survey asks respondents to assess conditions relative to the same period in the previous year, conditions relative to the previous quarter, and for their expectations for the following quarter relative to the current quarter.
Job Availability
The slight improvement in the overall economic conditions relative to the previous quarter largely was due to increased sentiment on job availability over last quarter (Chart 2). This was supported by the national survey results for the Tenth District on job availability (Chart 5). From the national survey in June, 93% of respondents stated income/job loss/unemployment was worsening. This improved to 58% in August but worsened again by October (78%). The uptick in jobs over the summer has not been particularly strong or sustained long enough to recover to where the economy was in February.
Respondents to the LMI survey suggested they had weakened confidence in job availability next quarter. Based on comments in the LMI survey, doubt about future job availability was due to increasing numbers of small businesses closing and rising COVID cases further threatening businesses. Indeed, shortly after this survey was administered many places across the United States instituted stricter business occupancy limits.
Chart 2: Job availability improved over last quarter, but expectations for next quarter are negative
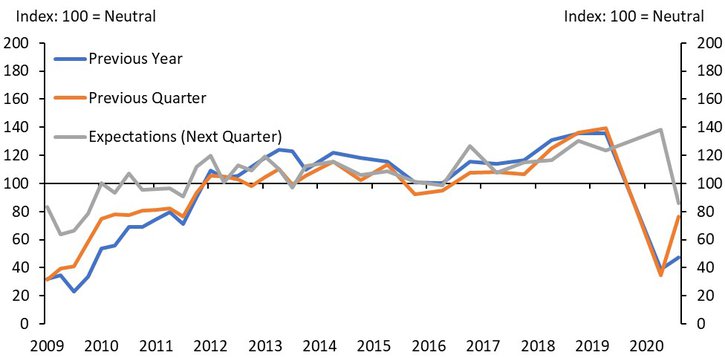
Source: Federal Reserve Bank of Kansas City LMI Survey.
Note: The survey asks respondents to assess conditions relative to the same period in the previous year, conditions relative to the previous quarter, and for their expectations for the following quarter relative to the current quarter.
Across the Tenth District, the economy has struggled to recover to where it was in February (Table 1). The Leisure and Hospitality industry, in particular, has struggled to recover. This was expected as their business depends on crowds which are not accommodated well during the pandemic. With rising COVID cases leading to additional restrictions on gatherings, the Leisure and Hospitality industry likely will continue to struggle until the pandemic is under control. This largely affects LMI workers given their concentration in the industry. But other industries like manufacturing also are struggling, likely due to weak consumer demand. It is too early to tell what the long-term prospects are for manufacturing jobs in the District and what effect that may have on LMI workers.
Table 1: Employment down across Tenth District since February with the Leisure and Hospitality sector facing the largest deficits
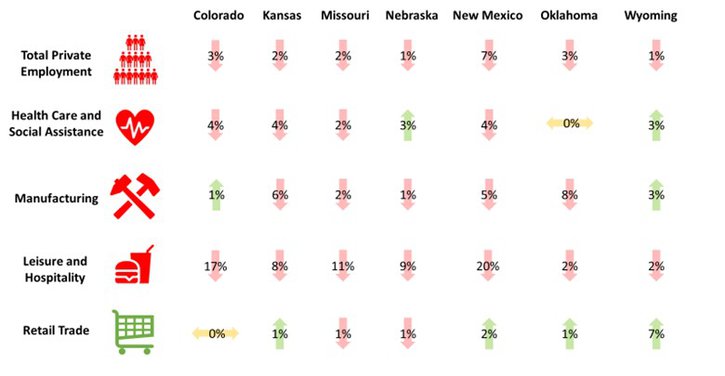
Source: Current Employment Statistics, Bureau of Labor Statistics, February-October, 2020, not seasonally adjusted.
Note: Percentages are calculated as a percent of employment loss between February and October 2020.
Affordable Housing
The affordable housing index worsened considerably since June (Chart 3). The index had its worst drop in the survey’s history. However, current circumstances are more related to an inability to pay rent due to job loss or wage reduction rather than increased rents. The problem was leading to more demand for services from those experiencing housing insecurity according to responses to the special question this quarter.
Chart 3: Affordable housing index substantially worse since June
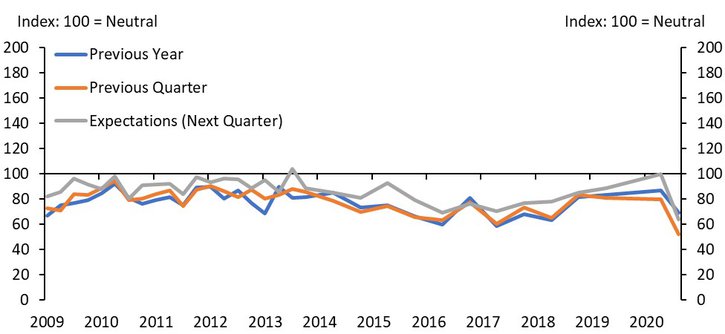
Source: Federal Reserve Bank of Kansas City LMI Survey.
Note: The survey asks respondents to assess conditions relative to the same period in the previous year, conditions relative to the previous quarter, and for their expectations for the following quarter relative to the current quarter.
The looming evictions crisis was concerning to many contacts. At the time of the survey there was uncertainty about whether the moratorium would be extended, whether there would be additional money coming from Congress to cover back rent, and the long-term effects on affordable housing as landlords struggle with lower rent collections. Even though the national eviction moratorium recently was extended and now expires at the end of January and $25 billion was provided to cover back rent, the problem will not be solved in a month or with that amount of money. According to Week 19 of the U.S. Census Bureau’s Household Pulse Survey (conducted Nov. 11–23), over a quarter million renters in the Tenth District who have a household income of less than $35,000 could be at risk of eviction with the end of the eviction moratorium (Table 2). A Federal Reserve Bank of Philadelphia study suggested that renter households that had an experience with pandemic-related unemployment could owe $5,400 in back rent by the end of the year._
Table 2: Over a quarter million low-income renters in Tenth District could be at risk of eviction
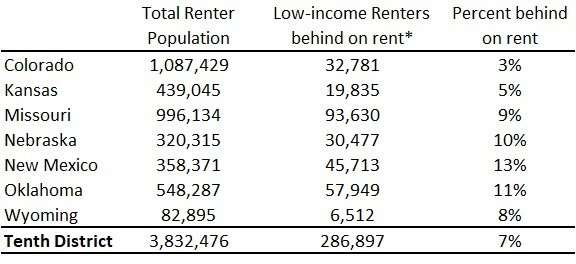
Source: U.S. Census Bureau Household Pulse Survey, Week 19, Nov. 11-23, 2020.
Note: The data are from a small-sample survey and may have large margins of error. Use with caution. Data for Missouri and New Mexico represents the full state. *Low-income is defined here as households earning less than $35,000
National COVID Survey Results for the Tenth District
The National COVID Survey conducted by the Federal Reserve System was an effort to track conditions in LMI communities throughout the pandemic. For the Tenth District, surveys went to the same organizations that receive the LMI Survey. The National Survey asked many more questions than the LMI survey, and some questions were added or modified between the four survey periods. Like the LMI Survey, there was a large drop in responses to the National Survey between April and October. The analysis here focuses on questions related to the conditions of LMI communities and the responding organizations.
As suggested from the LMI survey, conditions affecting LMI populations have deteriorated (Chart 4). An increase in jobs in the summer was a temporary phenomenon. Jobs and health indicators from the National Survey tracked closely, emphasizing the relationship between the pandemic and the economy.
Chart 4: National COVID Survey results the Tenth District show respondents indicated conditions for LMI populations continued worsen throughout 2020
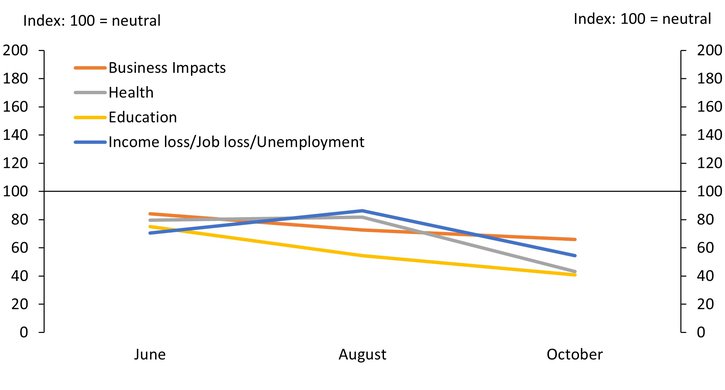
Source: National COVID Survey, Federal Reserve System, 2020.
Note: Questions asked respondents whether conditions in the categories were getting “significantly better,” “modestly better,” “no change,” “modestly worse,” or “significantly worse.” Diffusion indexes only rate whether better or worse. These questions were not asked in the April survey.
Respondents reported a surge of demand early in the pandemic, but demand for services began leveling off throughout the summer (Chart 5). This does not quite follow what the LMI Survey showed. The LMI Survey timing may explain the difference as it was conducted shortly before Thanksgiving. It also could be an anomaly of the response rate. Organizations seemed to be able to reliably continue providing services. Even though expenses were rising, organizations were able to maintain or increase their staffing levels. This is good news for LMI populations seeking assistance.
Chart 5: While pandemic stressed organizations early, conditions appear to be leveling off
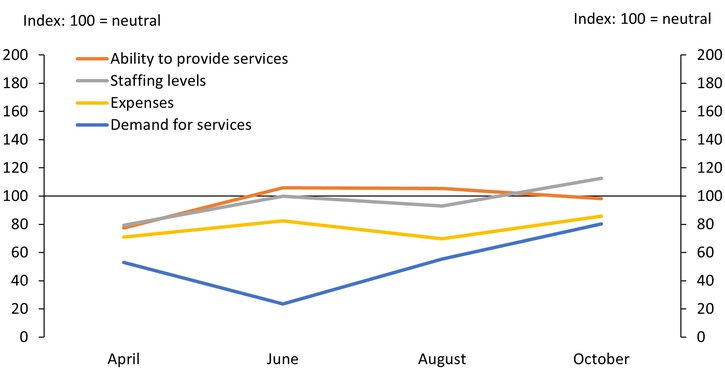
Source: National COVID Survey, Federal Reserve System, 2020.
Note: Questions asked respondents whether conditions in the categories were getting “significantly better,” “modestly better,” “no change,” “modestly worse,” or “significantly worse.” Diffusion indexes only rate whether better or worse.
Organizational funding levels in the Tenth District seemed relatively unharmed due to the pandemic. Government funds likely were elevated over other funding sources due to the distribution of CARES Act and other government funds. Even so, the stability of funding from other sources suggested organizations helping LMI populations were in a healthy financial position for the time being.
Chart 6: Funding for responding organizations seemed unaffected by the pandemic

Source: National COVID Survey, Federal Reserve System, 2020.
Note: Questions asked respondents whether conditions in the categories were getting “significantly better,” “modestly better,” “no change,” “modestly worse,” or “significantly worse.” Diffusion indexes only rate whether better or worse. April’s survey did not have a question for the type of donations by category. It only asked about “philanthropic funds.” The answer to that question was used for the April answers of the non-government categories.
Conclusion
The uncertainty of 2020 will extend into 2021. Respondents to the LMI survey were not confident that the issues affecting LMI communities across the Tenth District would be alleviated any time soon. Until the COVID-19 pandemic is contained enough for the economy to safely resume as normal, we should expect continued weak economic conditions for LMI populations.
We should expect housing to remain an issue for LMI populations throughout 2021. Low-income renters affected by the pandemic will need to pay for current rent plus any accrued rent debt in order to stay in their homes. This will put them in an unsustainable financial situation. Low-wages were insufficient to afford market-rate rents in most communities before the pandemic. Without assistance to address back rent, mass evictions may be a certainty. Renters unable to pay rent also have affected the finances of small landlords, who often have more affordable rents. If those landlords lose their rental properties to foreclosure or sale to corporate landlords, there likely will be a decrease in affordable units. This likely will make it even more difficult for low-income renters to find housing in 2021 and beyond.
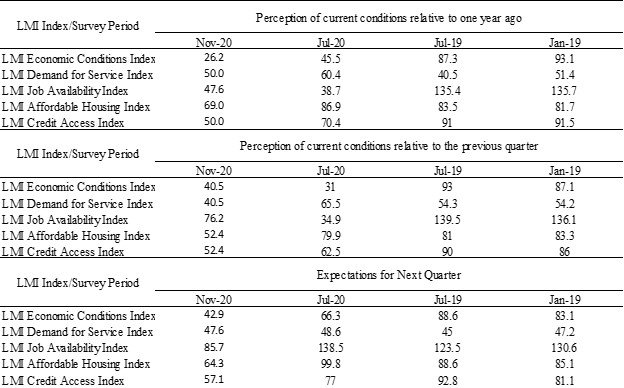
Appendix 1: Diffusion Indexes for Low-and-Moderate-Income Survey Responses
Diffusion Indexes
Survey participants respond to each survey question by indicating whether conditions during the current quarter were higher (better) than, lower (worse) than or about the same as in the previous quarter or year. Providers also are asked what they expect conditions to be in the next quarter. Diffusion indexes are computed by subtracting the percentage of survey participants that responded lower (worse) from the percentage that responded higher (better) and adding 100. The exception is the LMI Demand for Services Index, which is computed by subtracting the percentage of survey participants that responded higher from the percentage that responded lower and adding 100 so that higher needs translate into lower numbers for the index. A reading less than 100 indicates the overall assessment of respondents (balance of opinion) is that conditions are worsening. For example, an increase in the index from 70 to 85 would indicate conditions are still deteriorating, by consensus, but that fewer respondents are reporting worsening conditions. Any value more than 100 indicates improving conditions, even if the index has fallen from the previous quarter or year. A value of 100 is neutral.
Table 3: Diffusion Indexes for Low-and-Moderate-Income Survey Responses
Endnotes
-
1 [1] Reed and Divringi. (2020). “Household Rental Debt During COVID-19,” Federal Reserve Bank of Philadelphia. External Linkhttps://www.philadelphiafed.org/community-development/housing-and-neighborhoods/household-rental-debt-during-covid-19
The views expressed are those of the authors and do not necessarily reflect the positions of the Federal Reserve Bank of Kansas City or the Federal Reserve System.