Survey Description
In July 2017, the Board of Governors of the Federal Reserve System approved a new voluntary survey of U.S. commercial banks on their small business lending activities. The survey is being managed and administered by the Federal Reserve Bank of Kansas City. This report summarizes the results from the first survey period, which covers lending activity in the fourth quarter of 2017.
The Small Business Lending Survey is a quarterly collection of quantitative and qualitative information that will be used to understand credit market conditions for bank lending to small businesses. The survey captures detailed, comprehensive information that is not otherwise available about small business lending and how it changes from quarter to quarter. Specifically, quantitative information is collected on commercial and industrial (C&I) loan amounts, interest rates, maturities, and lending terms for term loans and lines of credit with fixed and variable interest rates, and applications received and approved. In addition, qualitative information is collected on changes in credit standards and terms and loan demand, as well as reasons for those changes.
In addition to collecting this new information, the survey is an improvement over other small business lending data collections that use loan size to define a small business loan, such as the Call Report. In this survey, a small business loan is defined as a loan made to a firm with $5 million or less in annual gross revenue.
Survey Purpose
Small businesses are critical for employment and economic growth at the local, regional, and national levels, and banks are one of their most important sources of funding. However, there has been a lack of detailed information about banks’ small business lending, which became apparent during the 2007-8 financial crisis and subsequent recovery. The purpose of the FR 2028D is to fill this important gap in ongoing information about small business lending.
The survey will provide policymakers and the general public with detailed information on banks’ small business lending activity and terms, with relatively little time lag, and will also provide information on small business access to credit in local communities. Together with other data collections on large business loans, the survey will enable Federal Reserve policymakers to construct a more complete picture of the overall bank lending to businesses.
Small Business Lending Conditions – 2017 Fourth Quarter
For this first survey, 97 banks with a total of $3.9 trillion of assets joined the panel and provided responses._ The sample includes 40 small banks (total assets of $1 billion or less), 31 mid-sized banks (total assets greater than $1 billion and less than or equal to $10 billion), and 26 large banks (total assets greater than $10 billion).
Chart 1: Loan Concentrations at Different Sized Banks
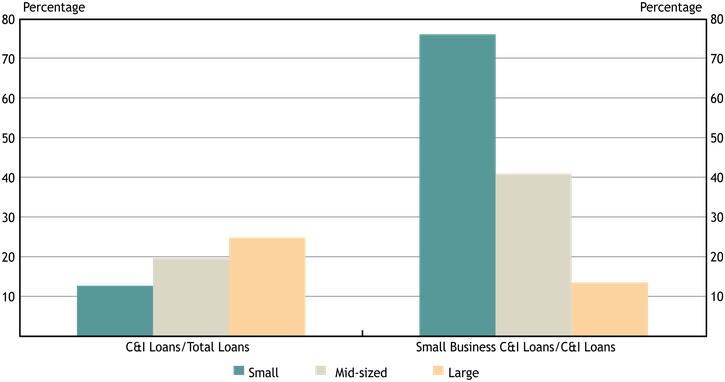
Source: FR 2028D items 4.b and 5.c.; Call Reports, schedule RC-C, items 4 and 12
Generally speaking, larger banks have higher concentrations of C&I loans, but not surprisingly smaller institutions have larger shares of small business C&I loans relative to total C&I loans. C&I loans account for about 13 percent of total loans at the average small bank and about 25 percent of total loans at the average large bank. The disparity in average small business C&I loan concentrations between small and large banks is much greater, with small business loans comprising about 76 percent of all C&I loans at the average small bank, but only about 13 percent of all C&I loans at the average large bank.
Chart 2: Weighted Average Interest Rates on New Small Business C&I Loans
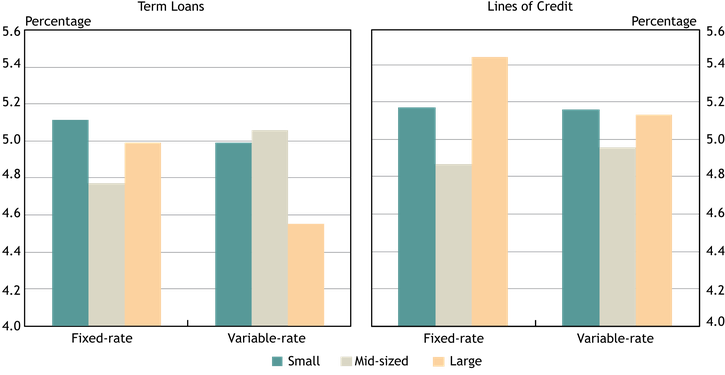
Notes: Weighted average interest rates are weighted by the dollar volume of small business C&I loans.
Source: FR 2028D, items 7.c and 10.d.
The weighted average interest rates on new small business term loans and lines of credit ranged from 4.5 to 5.4 percent, with the rates on lines of credit generally slightly higher than on term loans. Interest rates on fixed-rate loans – for both term loans and lines of credit – were on average higher than those on variable-rate loans for small and large banks, while the converse was true for mid-sized banks.
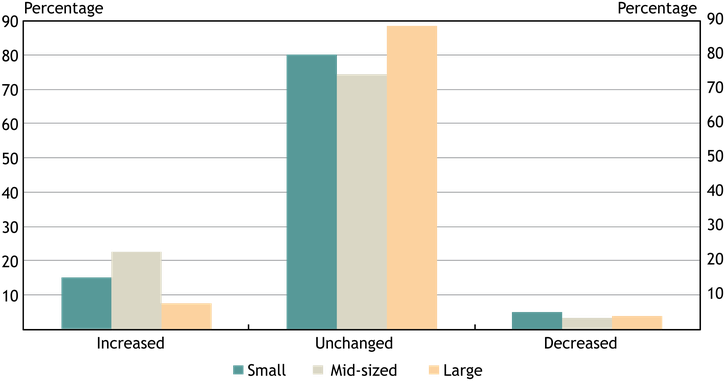
Chart 3: Changes in Credit Line Usage
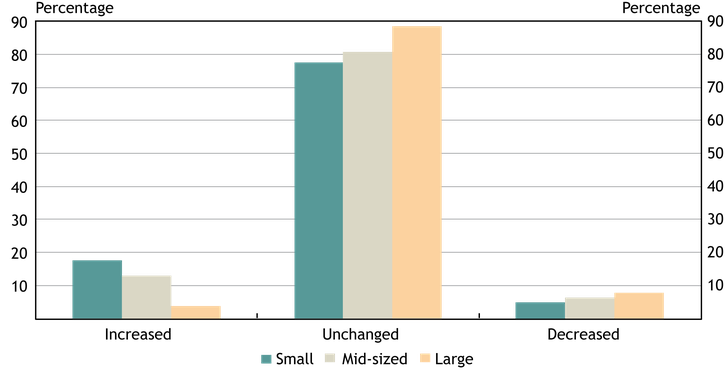
Source: FR 2028D, item 11.
About 20 percent of panelists reported a change in credit line usage during the last quarter of 2017. More respondents experienced an increase in credit line usage than a decrease, with the majority of those reporting an increase being small and mid-sized banks. Regardless of whether respondents reported an increase or decrease in usage, the most commonly cited reasons for the change were changes in local or national economic conditions and in borrowers’ business revenue or other business specific conditions.
Chart 4: Changes in Small Business C&I Loan Demand and Application Approval Rates
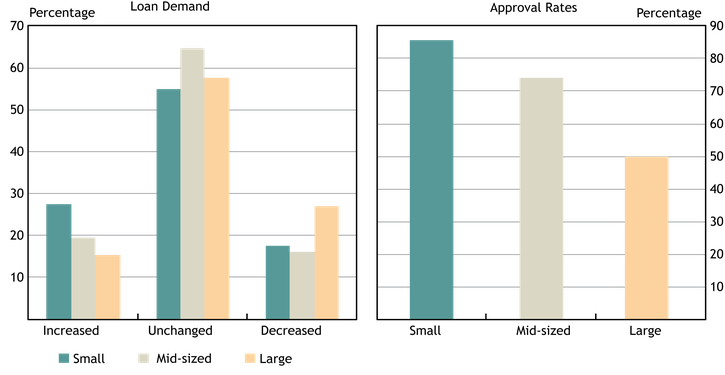
Source: FR 2028D, items 17 and 14.a.
Approximately 40 percent of respondents indicated a change in loan demand for small business C&I loans during the fourth quarter of 2017, with those respondents being split fairly evenly between experiencing an increase in demand and a decrease in demand. Among those banks reporting a change in small business loan demand, the large bank group had the smallest percentage of banks that had an increase in demand and the largest percentage of banks that had decrease in demand.
Application approval rates varied from 50 percent at large institutions to 86 percent at small institutions. The most commonly cited reasons for denying a loan include financials, collateral, and credit history, with financials being the most commonly cited reason by far.
Chart 5: Changes in Credit Quality
Source: FR 2028D, item 24.
Nearly 20 percent of panelists reported a change in the credit quality of applicants over the quarter, with the majority of those panelists reporting an improvement. Approximately two-thirds of panelists cited a change in the debt-to-income level of business owners as a very important reason for the improved credit quality. Other important reasons contributing to the improvement were the improved liquidity position of business owners and recent business income growth.
Chart 6: Net Percentage of Banks Reporting Tighter Credit Standards or Terms
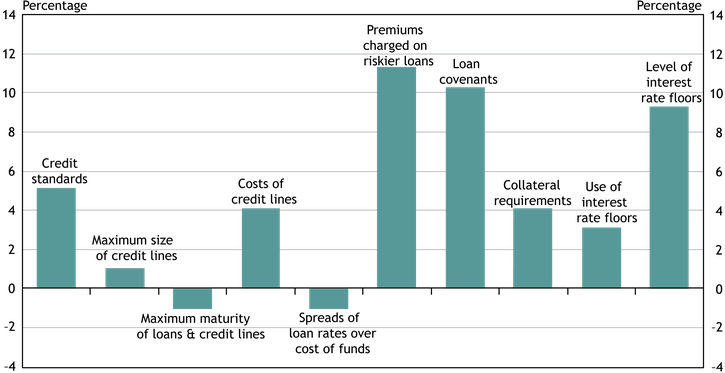
Notes: The net percentage refers to the percentage of banks that reported having tightened ("tightened considerably" or "tightened somewhat") minus the percentage of banks that reported having eased ("eased considerably" or "eased somewhat").
Source: FR 2028D, items 18 and 19.
Roughly half of the panelists indicated some change in credit standards or terms for small business C&I loans during the fourth quarter of 2017. The chart shows diffusion indexes for credit standards and various loan terms, which is the difference between the percentage of banks reporting a tightening and those reporting an easing. On net, banks tightened credit standards on all but two types of loan terms. Premiums on riskier loans, loan covenants, and the level of interest rate floors were the terms with the greatest degree of tightening.
Nearly 90 percent of the respondents who reported tightening indicated that a reduced tolerance for risk was an important factor in that decision. Other commonly cited reasons included worsening of industry-specific problems; less favorable or more uncertain economic outlook; and increased concerns about the effects of legislative changes, supervisory actions, or changes in accounting standards. Approximately 60 percent of respondents cited each of these as influencing the decision to tighten standards or terms.
More than 90 percent of respondents who indicated easing standards or terms reported that more aggressive competition from other banks was an important factor in that decision, and 70 percent of respondents cited more aggressive competition from nonbank lenders as important.
Contact Us
For questions or comments about this survey, contact us at KC SRM FR2028D Survey.
Endnotes
-
1
Because this is the first survey and the survey panel has not reached its full size, the data presented in this report are not as wide-ranging as they will ultimately become. For example, as data over time become available, we will be able to report growth rates in small business loans and average changes in small business loan interest rates and maturities. In addition, with a larger panel we will be able to provide additional breakdowns of small business lending conditions by regions of the country.