In the fourth quarter, new small business lending_ decreased when compared to the same period in 2023, while outstanding loan balances increased. Interest rates on new term loans and lines of credit decreased across all bank types, which aligns with the declining rate environment.
With over $75 billion in small business loans reported, the 168 survey respondents reported credit standards tightened for the thirteenth consecutive quarter and credit quality declined for the eleventh consecutive quarter. Loan demand increased for the first time since first quarter 2022, though loan application approval rates decreased across all bank sizes._
Chart 1: Outstanding Small Business (SB) Loans Increase
Skip to data visualization tableNote: Items are calculated using a subset of 118 respondents that completed the FR 2028D for the last five quarters surveyed.
Sources: Call Report, Schedule RC-C Part I, items 4. Commercial and Industrial Loans and 12. Total Loans and Leases Held for Investment and Held for Sale, and FR 2028D, items 5.b and 6.c.
| Quarter-Over-Quarter | Total Loans | C&I Loans | SB Loans |
|---|---|---|---|
| 2024:Q1 | -0.7 | 0.2 | 0.8 |
| 2024:Q2 | 0.5 | 0.2 | 0.4 |
| 2024:Q3 | -0.2 | -0.6 | -0.6 |
| 2024:Q4 | 0.5 | -2.9 | 0.9 |
| Year-Over-Year 2024:Q4 | 0.1 | -3.1 | 1.5 |
While total outstanding loans remained fairly stable year-over-year, commercial and industrial (C&I) loans decreased by 3.1 percent, and small business loans increased 1.5 percent. Quarter-over-quarter, total loans increased 0.5 percent, C&I loans decreased 2.9 percent, and small business loans increased by 0.9 percent.
Chart 2: New Small Business Loans Decrease Year-Over-Year
Skip to data visualization tableNote: Items are calculated using a subset of 118 respondents that completed the FR 2028D for the last five quarters surveyed. All loan types referenced in Chart 2 refer to small business lending.
Source: FR 2028D, items 7.b and 8.c.
| Quarter-Over-Quarter | Total New SB Loans | New SB Term Loans | New SB Credit Lines |
|---|---|---|---|
| 2024:Q1 | -11.0 | -11.7 | -9.8 |
| 2024:Q2 | -1.3 | -1.2 | -1.6 |
| 2024:Q3 | 7.2 | 2.3 | 15.3 |
| 2024:Q4 | 0.2 | 1.9 | -2.2 |
| Year-Over-Year 2024:Q4 | -5.6 | -9.0 | 0.1 |
When compared to fourth quarter 2023, total new loan balances decreased by 5.6 percent, driven by a 9.0 percent decrease in new term loans while new credit lines remained basically unchanged. The year-over-year decrease in new loans was primarily attributed to large bank activity. Quarter-over-quarter, total new loans balances remained stable, with a 1.9 percent increase in new term loans offset by a 2.2 percent decrease in new credit lines.
Chart 3: Total Credit Line Usage Remains Stable
Skip to data visualization tableSource: FR 2028D, items 6.b and 6.c.
| Quarter | Fixed | Variable | Total |
|---|---|---|---|
| 2020:Q1 | 56.20 | 44.62 | 44.97 |
| 2020:Q2 | 47.91 | 40.83 | 40.83 |
| 2020:Q3 | 47.09 | 37.33 | 38.09 |
| 2020:Q4 | 48.03 | 35.46 | 36.44 |
| 2021:Q1 | 44.09 | 33.74 | 35.38 |
| 2021:Q2 | 49.63 | 32.00 | 35.67 |
| 2021:Q3 | 47.83 | 36.33 | 37.55 |
| 2021:Q4 | 46.48 | 35.68 | 36.76 |
| 2022:Q1 | 47.91 | 35.62 | 36.22 |
| 2022:Q2 | 47.92 | 36.83 | 37.56 |
| 2022:Q3 | 50.07 | 36.67 | 37.90 |
| 2022:Q4 | 49.57 | 35.15 | 36.29 |
| 2023:Q1 | 50.88 | 34.44 | 36.43 |
| 2023:Q2 | 51.06 | 34.55 | 38.00 |
| 2023:Q3 | 48.28 | 34.83 | 38.17 |
| 2023:Q4 | 50.13 | 36.54 | 37.79 |
| 2024:Q1 | 51.65 | 36.47 | 38.28 |
| 2024:Q2 | 52.06 | 38.05 | 39.63 |
| 2024:Q3 | 52.05 | 38.15 | 39.62 |
| 2024:Q4 | 48.08 | 37.28 | 40.60 |
Median usage of total small business credit lines remained relatively stable in fourth quarter 2024. Usage of fixed rate lines of credit was 48 percent compared to 37 percent of variable rate lines of credit. Variable rate lines constituted a larger portion of credit lines issued by banks, with respondents indicating that they made up about 89 percent of total credit line usage.
Chart 4: Interest Rates Decrease for New Term Loans
Skip to data visualization tableNote: Items are calculated using a subset of 118 respondents that completed the FR 2028D for the last five quarters surveyed. Urban banks make up about 89 percent of the subset of respondents.
Source: FR 2028D, item 7.c.
| Quarter | Rural Fixed New Term Loans | Rural Variable New Term Loans | Urban Fixed New Term Loans | Urban Variable New Term Loans |
|---|---|---|---|---|
| 2023:Q4 | 8.02 | 7.4 | 7.91 | 8.64 |
| 2024:Q1 | 8.37 | 7.21 | 7.76 | 8.50 |
| 2024:Q2 | 8.14 | 8.48 | 7.76 | 8.50 |
| 2024:Q3 | 8.08 | 7.79 | 7.58 | 8.22 |
| 2024:Q4 | 7.44 | 7.15 | 7.31 | 7.61 |
Median interest rates decreased for all new term loans in fourth quarter 2024. Variable rates offered at urban banks remained the highest, while the lowest were variable rates offered at rural banks. The largest change quarter-over-quarter was a 65-basis point decrease in variable rates offered at rural banks. The most notable year-over-year change was a 103-basis point decrease in variable rates offered at urban banks._
Chart 5: Rates on New Lines of Credit (LOC) Decrease
Skip to data visualization tableNote: Items are calculated using a subset of 118 respondents that completed the FR 2028D for the last five quarters surveyed. Urban banks make up about 89 percent of the subset of respondents.
Source: FR 2028D, item 8.d.
| Quarter | Rural Fixed New LOC | Rural Variable New LOC | Urban Fixed New LOC | Urban Variable New LOC |
|---|---|---|---|---|
| 2023:Q4 | 8.00 | 8.63 | 6.90 | 8.99 |
| 2024:Q1 | 8.37 | 8.51 | 6.77 | 9.21 |
| 2024:Q2 | 7.56 | 8.66 | 7.05 | 8.97 |
| 2024:Q3 | 7.30 | 8.22 | 6.71 | 8.44 |
| 2024:Q4 | 7.06 | 7.39 | 6.47 | 7.92 |
Median interest rates offered for new lines of credit at both urban and rural banks decreased in fourth quarter 2024, in alignment with the declining rate environment. Variable rates offered at urban banks decreased to 7.9 percent, while rural rates decreased to 7.4 percent. Fixed rates offered at urban banks decreased to 6.5 percent, while rural rates decreased to 7.1 percent. The largest decrease quarter-over-quarter and year-over-year were for variable rates offered at rural banks, declining by 83 and 124-basis points, respectively.
Chart 6: Interest Rate Floor Spreads Continue to Decrease for Term Loans and Lines of Credit
Skip to data visualization tableNote: Spread refers to the distance between the weighted average nominal interest rate and the weighted average interest rate floor.
Sources: FR 2028D, items 5.c, 5.h, 6.d, 6.g
| Quarter | Median Term Loan Spread | Median LOC Spread |
|---|---|---|
| 2023:Q4 | 282.1 | 445.1 |
| 2024:Q1 | 265 | 416.5 |
| 2024:Q2 | 291 | 388.1 |
| 2024:Q3 | 278.5 | 360.3 |
| 2024:Q4 | 255.0 | 312.9 |
Interest rate floor spreads decreased on outstanding term loans and lines of credit in fourth quarter 2024. The median spread on term loans decreased to 255-basis points, a 24-basis point decrease. The median spread on lines of credit decreased to 313-basis points, a 47-basis point decrease.
Chart 7: Proportion of Banks Reporting an Increase in Credit Line Usage Rises
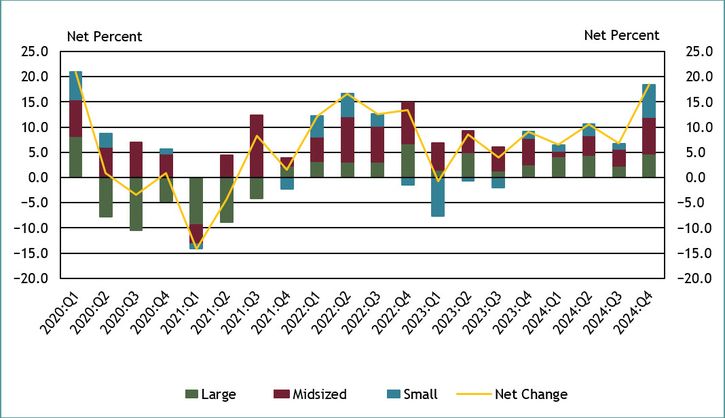
Note: Chart 7 shows diffusion indexes for credit line usage. The diffusion indexes show the difference between the percent of banks reporting decreased credit line usage and those reporting increased credit line usage. Net percent refers to the percent of banks that reported having increased usage (“increased somewhat” or “increased substantially”) minus the percent of banks that reported having decreased usage (“decreased somewhat” or “decreased substantially”).
Source: FR 2028D, items 9 and 10.
In fourth quarter 2024, 26 percent of respondents reported a change in credit line usage. About 18 percent of respondents, on net, indicated that credit line usage increased, up from 7 percent last quarter.
On net, all bank sizes reported an increase in credit line usage for the fifth straight quarter. Of the banks reporting an increase, about 35 percent cited changes in borrowers’ business revenue or other business-specific conditions and changes in local or national economic conditions as very important reasons.
The reported increase in credit line usage is consistent with a shift to increased debt financing observed in other key indicators such as elevated consumer credit card debt. _ Total household credit card debt continues to increase each quarter._
Chart 8: Respondents Report Increases in Loan Demand for First Time Since First Quarter 2022
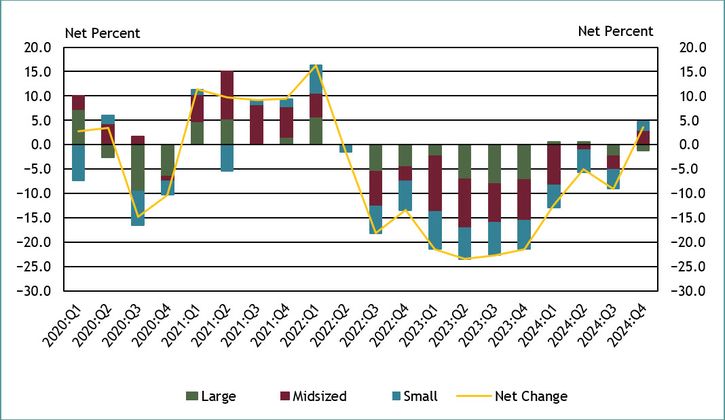
Note: Chart 8 shows diffusion indexes for loan demand. The diffusion indexes show the difference between the percent of banks reporting weakened loan demand and those reporting stronger loan demand. Net percent refers to the percent of banks that reported having stronger loan demand (“moderately stronger” or “substantially stronger”) minus the percent of banks that reported having weakened loan demand (“moderately weaker” or “substantially weaker”).
Source: FR 2028D, item 11.
About 31 percent of respondents reported a change in small business loan demand in fourth quarter 2024. On net, about 4 percent of respondents indicated stronger loan demand across all bank sizes. This marks the first time since first quarter 2022 in which respondents have reported a net increase in loan demand.
The reported stronger loan demand is consistent with the External LinkJanuary 2025 Federal Reserve Senior Loan Officer Opinion Survey (SLOOS), where about 19 percent of respondents reported stronger C&I loan demand from small firms (annual sales of less than $50 million) over the prior three months.
Chart 9: Overall Credit Quality Declines for the Eleventh Consecutive Quarter
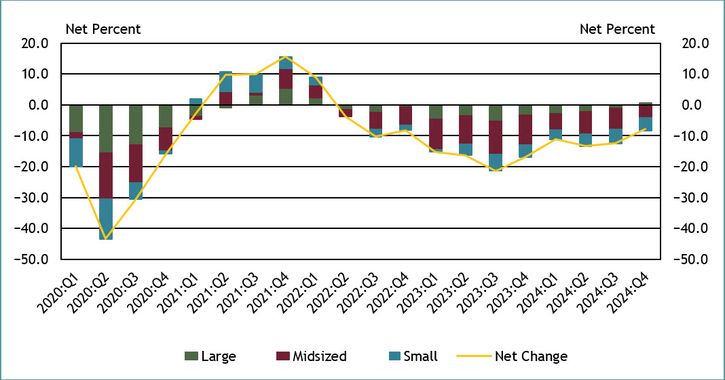
Note: Chart 9 shows diffusion indexes for credit quality of applicants. The diffusion indexes show the difference between the percent of banks reporting a decline in credit quality and those reporting improvement in credit quality. Net percent refers to the percent of banks that reported improving credit quality (“improved somewhat” or “improved substantially”) minus the percent of banks that reported declining credit quality (“declined somewhat” or “declined substantially”).
Source: FR 2028D, items 18 and 19.
About 8 percent of survey respondents, on net, reported a decrease in applicant credit quality. This is the eleventh consecutive period in which respondents, on net, reported a decrease. However, for the first time since first quarter 2022, large banks reported an increase in applicant credit quality.
Of the respondents reporting a change in credit quality, whether an increase or decrease, 68 percent cited the debt-to-income level of business owners as a very important reason for a change. Other commonly cited reasons for a change include liquidity position of business owners and recent business income growth.
The net decrease in applicant credit quality reported by firms is consistent with the negative outlook of loan availability reported by small businesses in the External LinkJanuary 2025 NFIB Survey of Loan Availability.
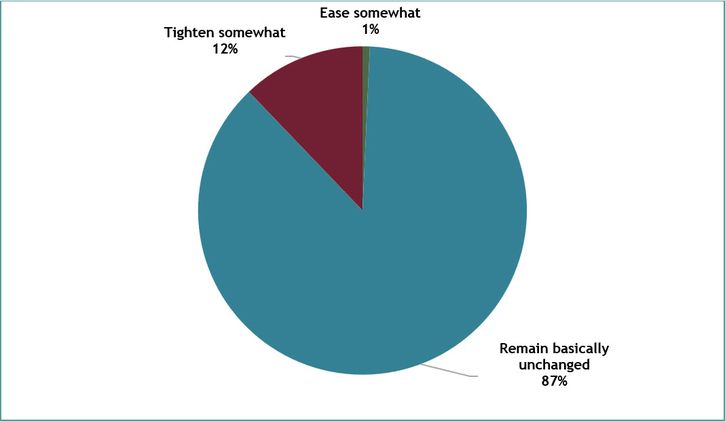
Chart 10: Most Respondents Indicate Performance of Existing Small Business Loans Will Not Affect Credit Standards for New Loans
Source: FR 2028D, Special Question.
Even as credit quality continues to decline, respondents predominantly do not expect to change their underwriting standards. Still, more respondents expect to tighten standards than expect to ease them. When asked “How do you expect the performance of existing C&I loans to small businesses to affect your credit standards for new loans over the next 12 months?”, about 87 percent of respondents said credit standards would remain basically unchanged, while about 12 percent said credit standards would tighten somewhat.
Chart 11: Loan Approval Rates Decrease
Skip to data visualization tableSource: FR 2028D, items 12.a and 13.
| Quarter | Small | Midsized | Large |
|---|---|---|---|
| 2020:Q1 | 87 | 75 | 52 |
| 2020:Q2 | 88 | 95 | 75 |
| 2020:Q3 | 87 | 90 | 38 |
| 2020:Q4 | 90 | 80 | 46 |
| 2021:Q1 | 90 | 88 | 51 |
| 2021:Q2 | 94 | 90 | 47 |
| 2021:Q3 | 71 | 85 | 50 |
| 2021:Q4 | 81 | 87 | 51 |
| 2022:Q1 | 83 | 77 | 51 |
| 2022:Q2 | 83 | 80 | 52 |
| 2022:Q3 | 87 | 87 | 48 |
| 2022:Q4 | 86 | 69 | 48 |
| 2023:Q1 | 87 | 68 | 50 |
| 2023:Q2 | 84 | 67 | 48 |
| 2023:Q3 | 88 | 68 | 52 |
| 2023:Q4 | 89 | 66 | 49 |
| 2024:Q1 | 93 | 73 | 49 |
| 2024:Q2 | 85 | 71 | 46 |
| 2024:Q3 | 92 | 70 | 45 |
| 2024:Q4 | 90 | 69 | 44 |
Application approval rates slightly decreased for all bank sizes in fourth quarter 2024. About 76 percent of respondents indicated borrower financials as the most common reason for denying a loan. Other commonly cited reasons were borrower credit history and collateral.
Chart 12: Respondents Report Tightening Credit Standards for the Thirteenth Consecutive Quarter
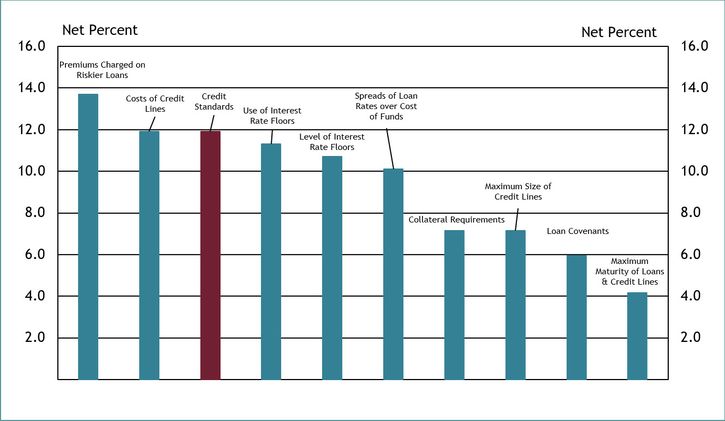
Note: Chart 12 shows diffusion indexes for credit standards (red bar) and various loan terms. The diffusion indexes show the difference between the percent of banks reporting tightening terms and those reporting easing terms. Net percent refers to the percent of banks that reported having tightened (“tightened somewhat” or “tightened considerably”) minus the percent of banks that reported having eased (“eased somewhat” or “eased considerably”).
Source: FR 2028D, items 14, 15, 16 and 17.
About 12 percent of respondents, on net, reported tightening credit standards (red bar) in fourth quarter 2024. This is the thirteenth consecutive quarter that respondents have reported tightening credit standards and is consistent with the tightening credit standards reported in the External LinkJanuary 2025 Federal Reserve Senior Loan Officer Opinion Survey (SLOOS).
On net, respondents indicated that all loan terms tightened. About 87 percent of respondents cited less favorable or more uncertain economic outlook as a somewhat important or very important reason for the tightening. Other commonly cited reasons were worsening of industry-specific problems and reduced tolerance for risk.
Other contributors to the release include Alli Baranski, Lauren Bennett, Sophie Burge, Connor Jamison, Christina Louie, and Jordan Pandolfo.
Endnotes
-
1
Small business lending refers to commercial and industrial lending to organizations generally defined as having less than $5 million in gross annual revenue, unless otherwise noted.
-
2
Small banks have total assets of $1 billion or less, midsized banks have total assets between $1 billion and $10 billion and large banks have total assets greater than $10 billion.
-
3
Urban and rural classification is determined exclusively by the bank’s head office location and External LinkUS Census Population data.
-
4
Source: FRED, Consumer Loans: Credit Cards and Other Revolving Plans
-
5
Source: FRBNY Consumer Credit Panel/Equifax