Agricultural credit conditions in the Tenth District softened during the third quarter. Farm income and loan repayment rates were lower than a year ago for the second quarter in a row. The moderation was more pronounced in areas most impacted by drought, but more tempered in areas most concentrated in cattle production. Conditions have weakened slightly following two years of significant improvement that continued to support loan performance. Despite softening farm finances and substantially higher interest rates, agricultural real estate values in the region remained firm.
The agricultural economy has softened in recent quarters alongside a moderation in commodity prices. Together with elevated production costs, a drop in the price of many key products over the past year has likely reduced farm income in 2023. Strong cattle prices have boosted margins for many ranches and feedlots, but profit opportunities have been much narrower for crop producers. Despite softening incomes and high interest costs, agricultural loan performance has remained solid with ongoing support from strong finances that bolstered the sector over the past two years.
Farm Finances and Credit Conditions
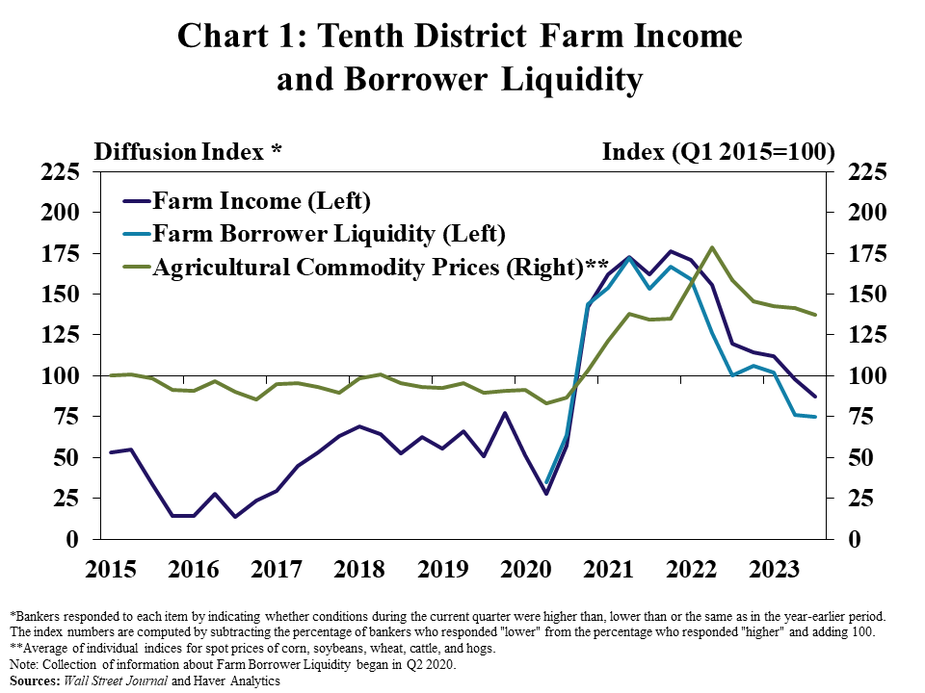
Farm income and producer liquidity cooled in recent months alongside lower commodity prices. Nearly half of respondents in the third quarter survey reported that farm income and borrower liquidity were less than a year ago, the highest share since 2020 (Chart 1). Farm financial conditions have softened from considerably strong levels as prices of key commodities have moderated.
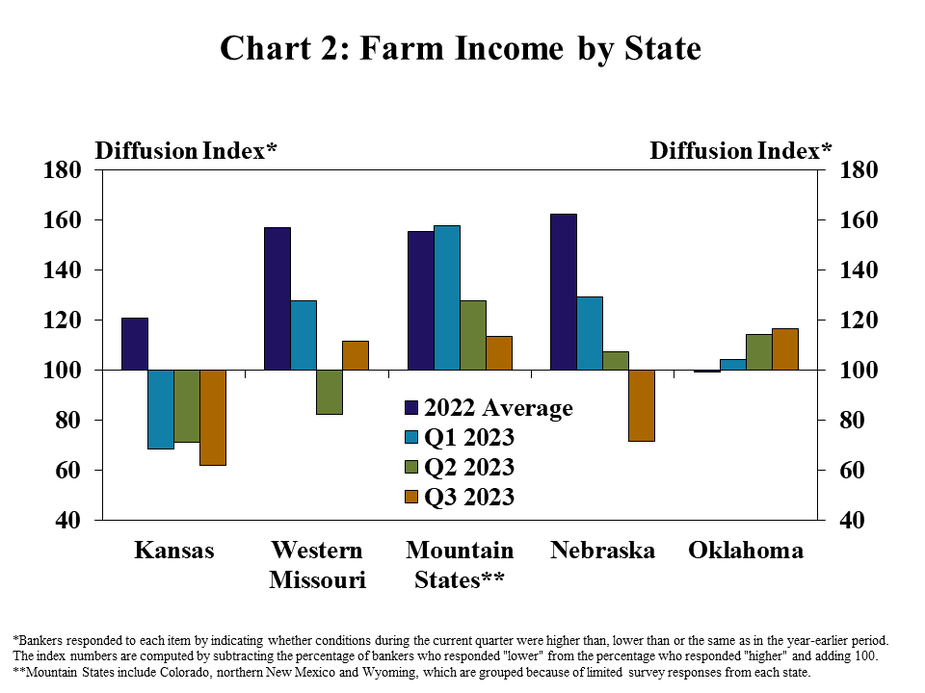
Prospects for income were comparably worse in some states, depending on their industry concentration. Farm income was higher than a year ago in states more dependent on cattle production such as Oklahoma and the Mountain States (Chart 2). In contrast, conditions deteriorated at a moderate pace in Kansas and Nebraska which have many areas dependent on revenue from corn, soybeans, and wheat.
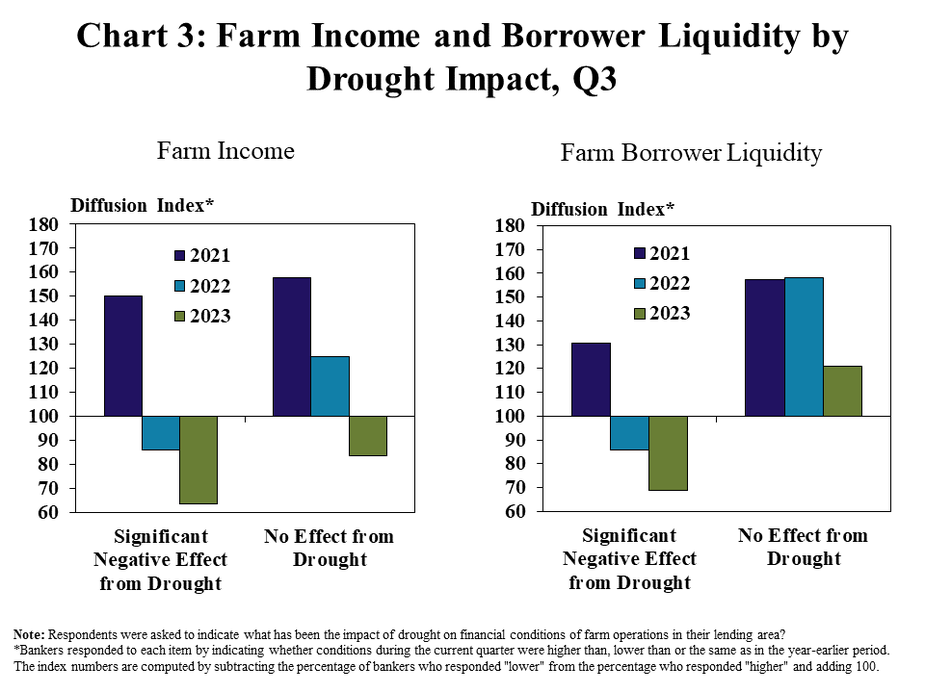
Drought was another key factor contributing to deterioration in farm finances. For banks indicating that drought was not impacting the financial conditions of their borrowers, farm income was higher than a year ago, but conditions weakened notably for areas significantly affected (Chart 3, left panel). Similarly, farm borrower liquidity declined at a faster pace in areas significantly impacted by drought (Chart 3, right panel).
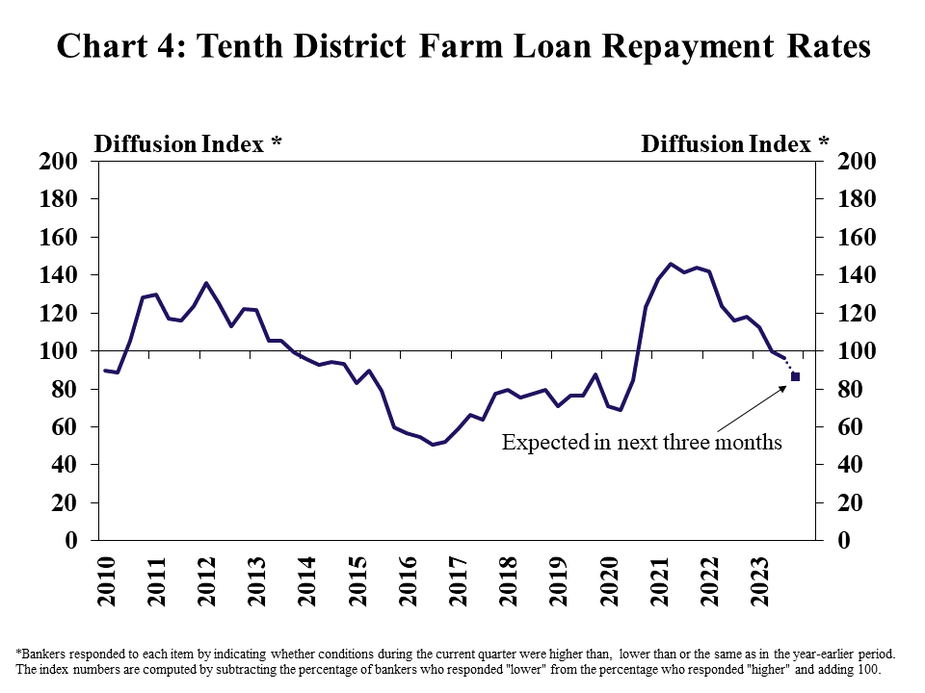
Alongside a moderation in farm income, credit conditions softened. Improvement in farm loan repayment rates halted with about 80% of lenders reporting repayment was unchanged from a year ago (Chart 4). Only about 10% of banks reported lower repayment rates during the quarter, however, and 20% expected a decline in the coming months.
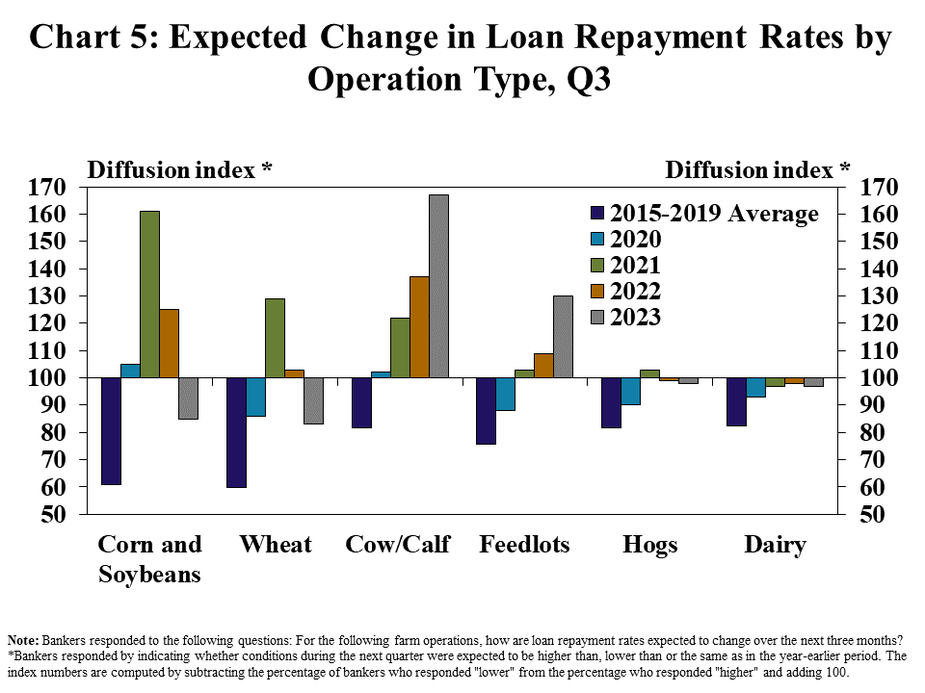
Credit conditions for crop producers were expected to deteriorate in the months ahead while survey respondents anticipated conditions to improve for cattle producers. Lenders expected a modest pace of decline in loan repayment rates for crop, hog and dairy producers in the next quarter alongside lower prices and thinner margins (Chart 5). The strength in cattle prices was expected to support improved repayment conditions for cow/calf producers and feedlots.
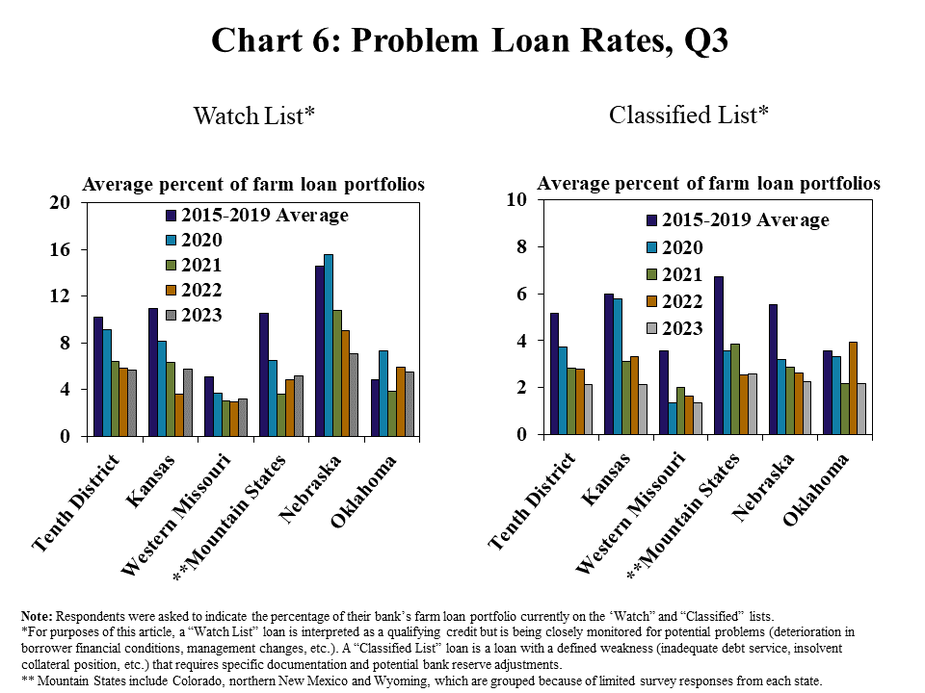
Despite signs of a reduced rate of loan repayment, credit quality of agricultural loans remained strong across the region. The share of farm loan portfolio volumes identified for watch and classified lists generally remained similar to a year ago in most states (Chart 6). Strong farm finances in recent years have bolstered many producers and problem loan rates remained at or near historic lows.
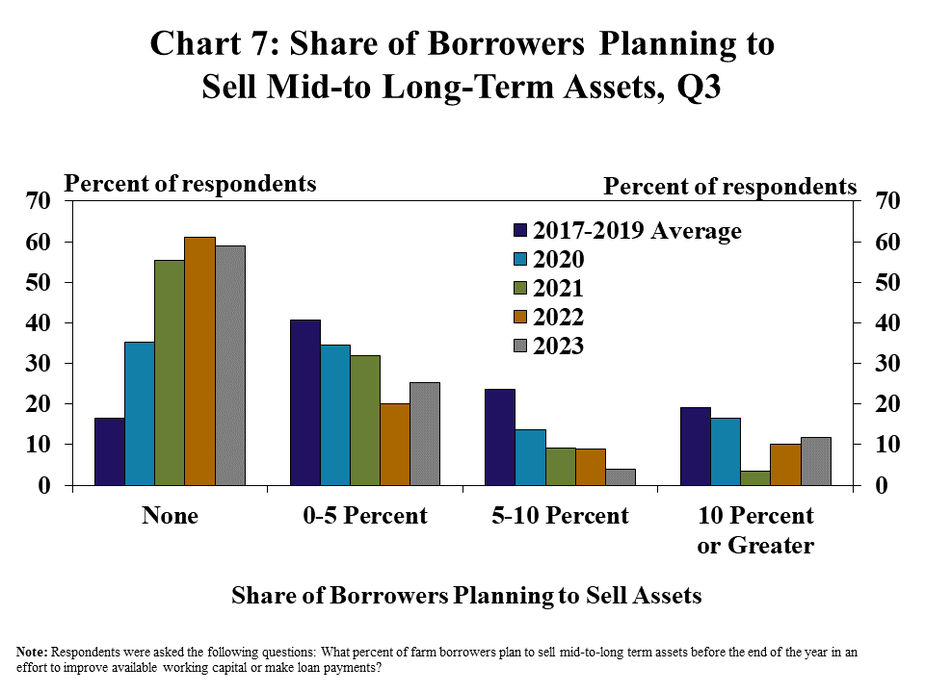
Alongside ongoing strength in loan performance, few borrowers had plans of liquidating assets to improve working capital. More than half of bankers in the District expected no borrowers to sell assets for liquidity purposes and another quarter thought less than 5% of their customers would have liquidations (Chart 7). The portion of banks with elevated instances of asset sales remained modest.
Interest Rates, Lending Activity and Farmland Values
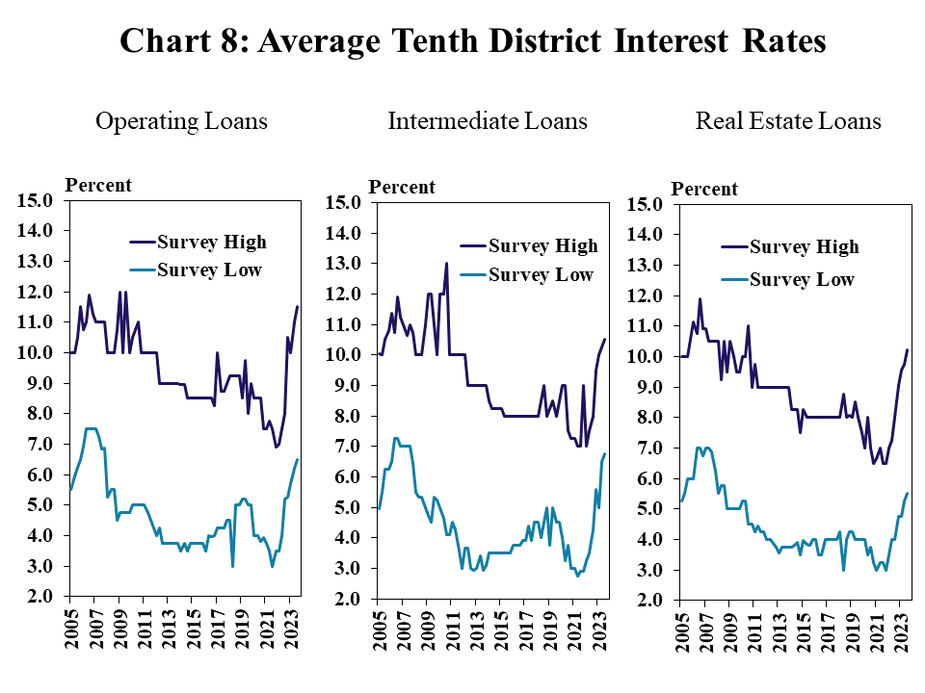
The moderation in agricultural credit conditions has coincided with a rapid rise in farm loan interest rates. The lowest average rates offered on non-real estate and real estate farm loans has increased about 400 and 300 basis points, respectively over the past two years (Chart 8). The highest average rates have grown by a similar amount with many borrowers paying a rate of interest on farm debt above 10%.
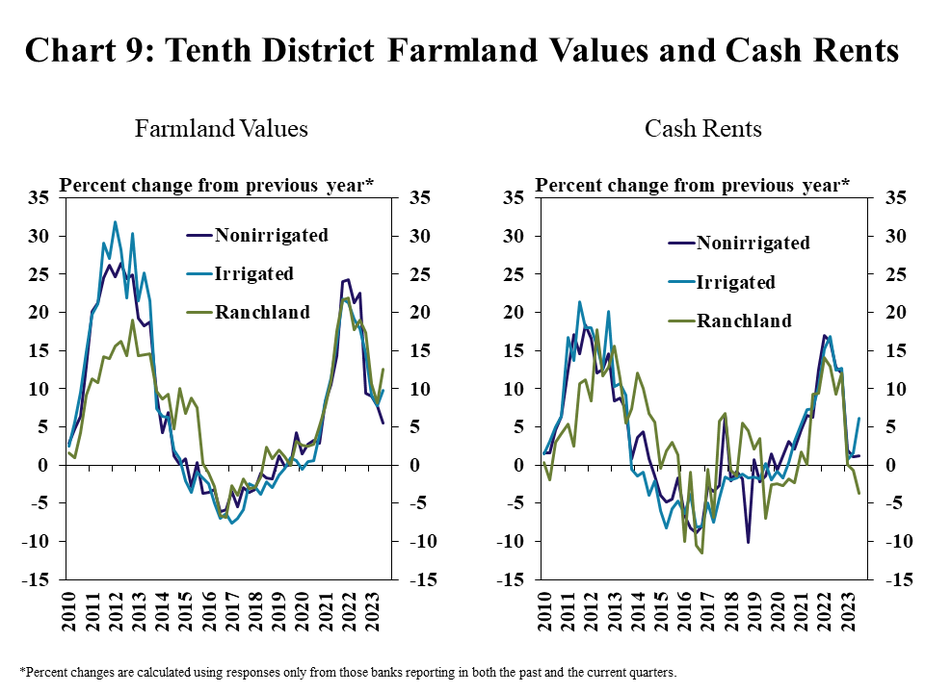
Despite the rapid rise in interest rates and a recent moderation in the farm economy, agricultural real estate values held firm. The value of nonirrigated cropland was about 5% higher than a year ago and cash rents on those acres increased by about 2% (Chart 9). Irrigated and ranchland values grew by about 10% and, while cash rents on irrigated acres increased, rent charges on ranchland were lower than a year ago.
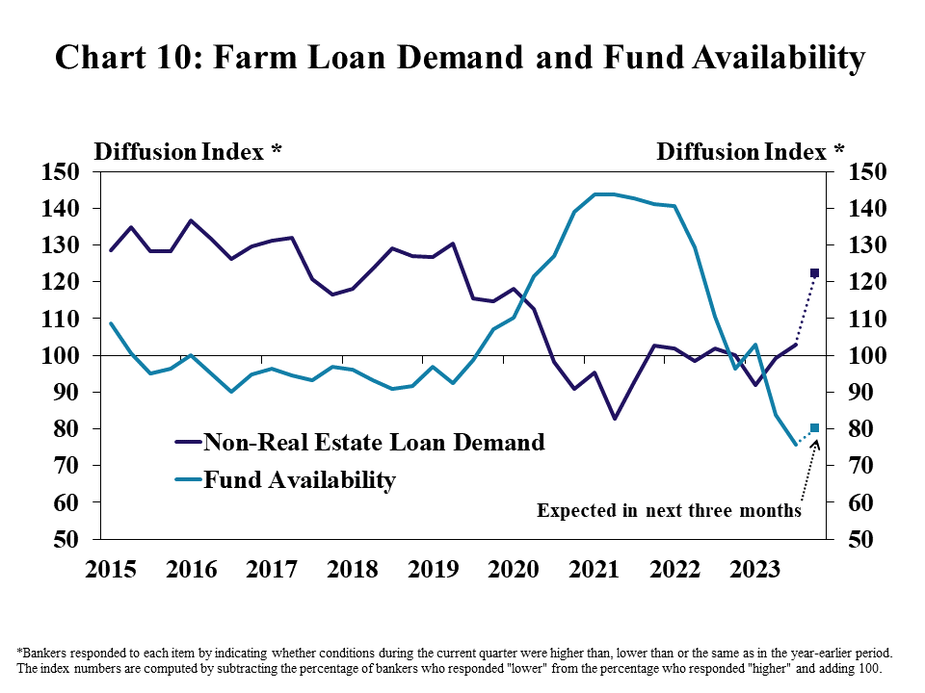
Farm loan demand remained subdued for many lenders alongside high financing costs, while fund availability diminished from record highs. Nearly equal shares of respondents reported higher and lower demand for non-real estate farm loans, but a far higher share expect demand growth in the coming months (Chart 10). Availability of funds was lower for nearly a third of lenders as deposit levels have moderated.
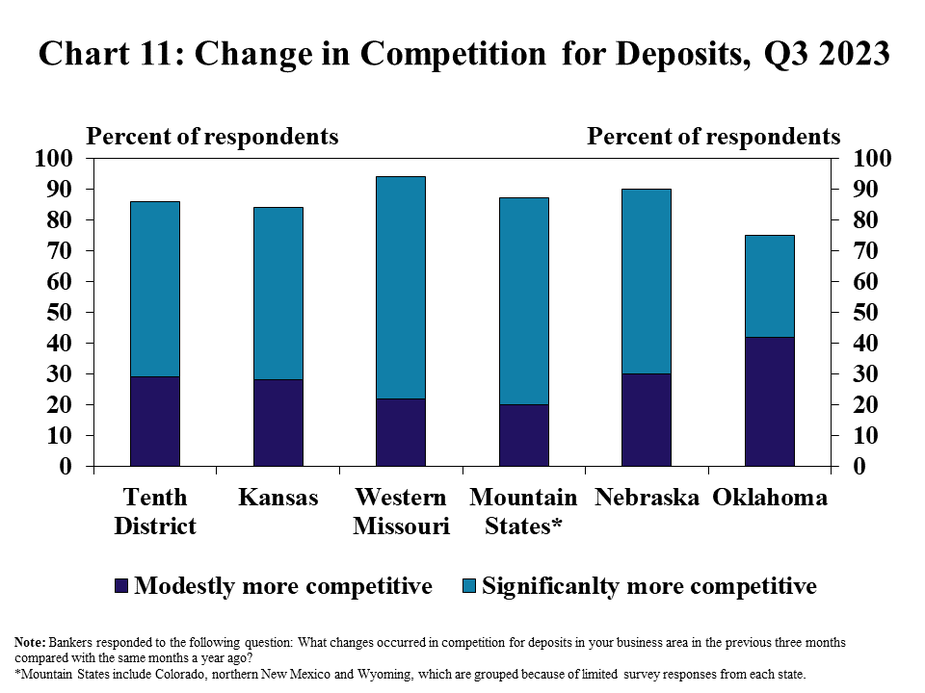
A considerable increase in competition has contributed to a reduction in deposits at many agricultural banks. A majority of lenders across all states in the District reported that competition for deposits increased significantly from a year ago (Chart 11). Higher benchmark rates have pushed up rates on deposits and similar products, intensifying competition and increasing funding costs.
Banker Comments Q3 2023
“Expenses in all categories (fuel, chemical, repairs, etc.) remain high while commodity prices have dropped.”– Southeast Colorado
“Last year we had the worst and biggest wildfire in New Mexico history that devastated many producers. The grazing land is in strong demand and water rights are at a premium, the beauty of the land is gone for many of the surrounding areas for decades to come.”– Northern New Mexico
“Inflationary pressures are impacting cashflows along with the increase in interest rates.”– Northern Wyoming
“Drought has been a major concern in this area for over 12 months.”– Southwest Kansas
“High interest rates have decreased the appetite for real estate purchases and capital purchases have also gone down due to interest rates and decreased liquidity due to lower grain prices. The one bright spot is cattle prices.”– Northwest Kansas
“Drought has significantly hurt our agricultural borrowers and rising interest rates and lower commodity prices are adding to the struggles.”– Southeast Kansas
“Severe drought and higher funding costs are concerns for community banking. Most farmers are in good financial condition, but the drought will impact everyone, and inflation is also a big factor.”– Central Missouri
“The drought has made a major impact on all row crops in our area. Pastures are in really bad shape. And hay is in short supply.”– Southwest Missouri
“Higher interest rates are significantly impacting ag income and bank liquidity is becoming critical and could affect loan availability in 2024.”– Northwest Nebraska
“Key concerns have been lack of moisture, higher interest rates, lower commodity prices and higher input costs.”– Northeast Nebraska
“Crop prices have been reduced to breakeven prices or less and dryland crops will be dependent on revenue insurance payments that most likely will be below the cost of production. The bright spot in our economy is the historically high cattle prices.”– Southwest Nebraska
“Moisture is again beginning to be a concern, due to low pond water, and ability to plant winter wheat in a timely manner.”– Northwest Oklahoma
“Drought in the wheat and cotton sector has really affected area farmers. If the cattle prices stay steady it could really affect their long run profits.”– Southwest Oklahoma
“Late summer rains should help soybeans and milo production and cow/calf will benefit too, but it was too late to help the hay crop much.”– Eastern Oklahoma
Data: Excel SpreadsheetCredit Conditions | Excel SpreadsheetFixed Interest Rates | Excel SpreadsheetVariable Interest Rates | Excel SpreadsheetLand Values
A total of 137 banks responded to the Third Quarter Survey of Agricultural Credit Conditions in the Tenth Federal Reserve District—an area that includes Colorado, Kansas, Nebraska, Oklahoma, Wyoming, the northern half of New Mexico and the western third of Missouri. Please refer questions to Nathan Kauffman, senior vice president and branch executive or Ty Kreitman, assistant economist at 1-800-333-1040.
The views expressed are those of the authors and do not necessarily reflect the positions of the Federal Reserve Bank of Kansas City or the Federal Reserve System.