Farm income and credit conditions continued to weaken in the first quarter of 2018, but at a slower pace than in previous quarters. According to the Tenth District Survey of Agricultural Credit Conditions, reduced farm income contributed to intensifying cash-flow concerns and tightening lending standards. Cash-flow shortages continued to limit the availability of working capital, and financing needs continued to rise.
Data
Credit Conditions | Fixed Interest Rates | Variable Interest Rates | Land Values
Farm Income and Liquidity
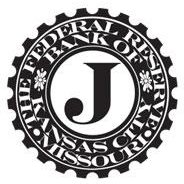
Despite moderate increases in prices of key agricultural commodities, District bankers reported that farm income and spending continued to decrease. The decline in the first quarter makes 2018 the fifth consecutive year that bankers have reported lower farm income than the year before (Chart 1). Although household spending and capital spending also have continued to decline, the pace of the decline in capital spending, which has historically followed farm income, has been relatively slower. Changes in farm income now seems to be more in line with changes in household spending, as farm households have attempted to adjust to lower incomes by reducing their expenses.
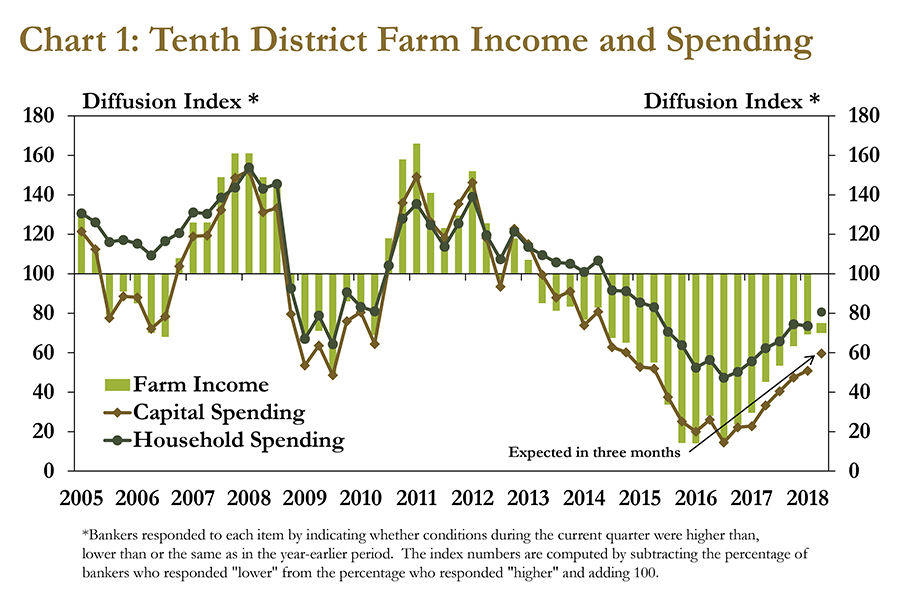
Reduced farm income also restricted cash flow and contributed to more farm loan denials than in recent years. In the first quarter, more than 8 percent of farm loan requests were denied because of customer cash-flow shortages (Chart 2). The largest share of denials occurred in Oklahoma, where wheat production makes up a larger share of farm revenue. One banker noted that almost all farm loan denials in the first quarter were because of cash-flow shortages.
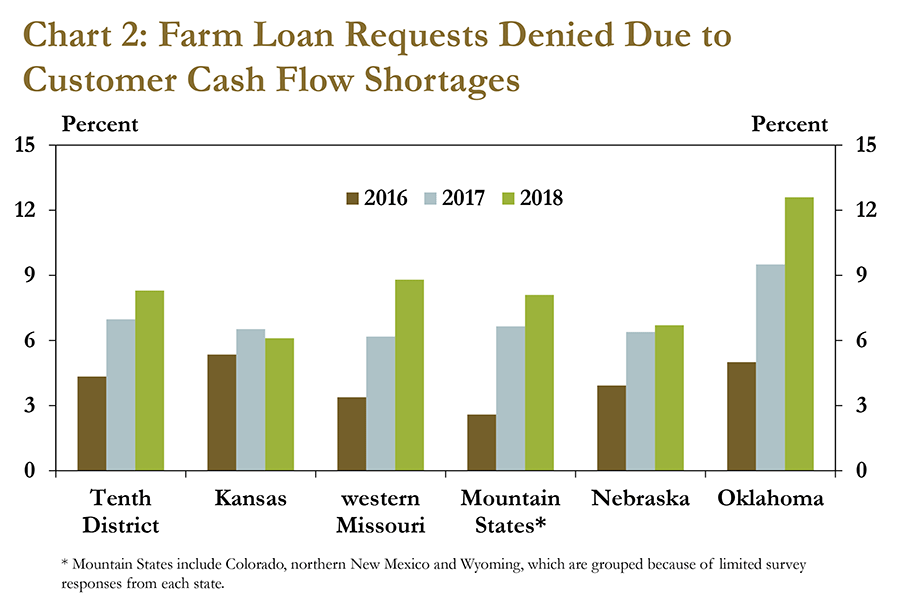
Despite a recent uptick in commodity prices, cash-flow shortages have reinforced concerns about liquidity in agricultural lending. In the first quarter of 2018, crop prices rose to their highest levels since 2016 (Chart 3, left panel). However, according to national data from the U.S. Department of Agriculture, working capital on farms across the country is expected to decline 65 percent in 2018 from 2012 levels (Chart 3, right panel).
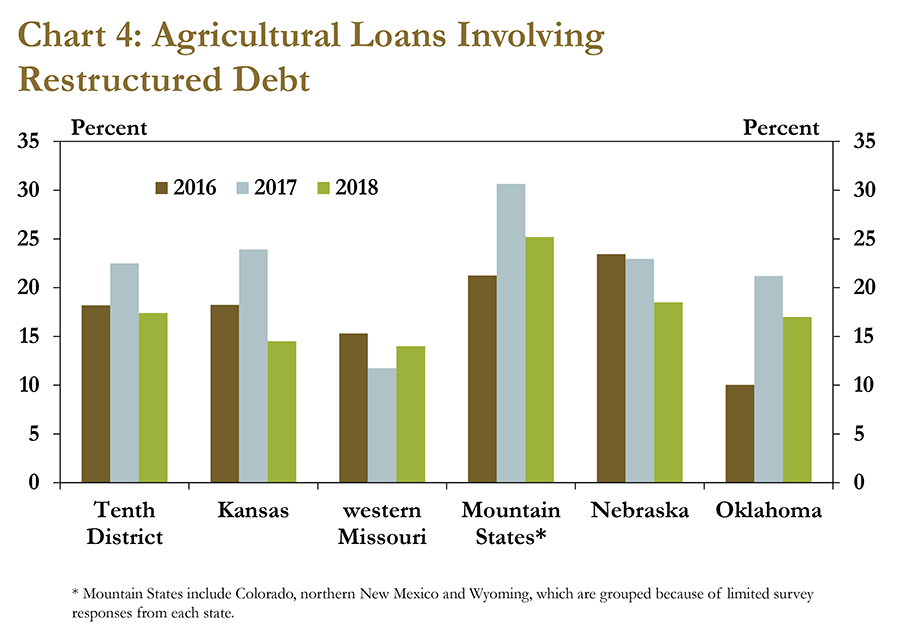
Alongside reduced liquidity on farms, bankers have continued to restructure debt, though at a slower pace than in previous quarters. Compared with last year, only bankers in western Missouri reported a higher percentage of loans that were restructured to meet short-term liquidity needs (Chart 4). Although restructuring was still utilized in other District states, it was on a lower percentage of loans than in previous quarters. The slower pace of restructuring, alongside a slower pace of decline in farm income, could suggest that higher prices played a role in stabilizing the farm economy in the first quarter.
Credit Conditions
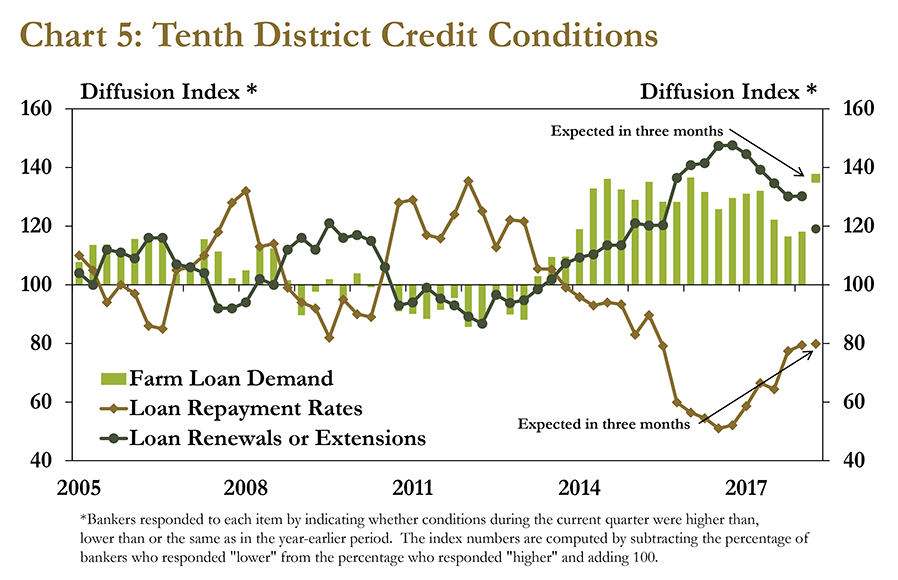
Similar to farm income, credit conditions continued to stabilize but remained weak in the first quarter of 2018. Rates of repayment on non-real estate farm loans continued to decline but at a slightly slower pace than in previous quarters (Chart 5). In addition, farm loan repayment rates were expected to decline again in the second quarter of 2018, but the pace of decline was expected to remain unchanged. In contrast, growth in loan demand ticked up slightly in the first quarter and was expected to increase substantially in the second quarter of 2018, while growth in loan renewals and extensions was expected to slow.
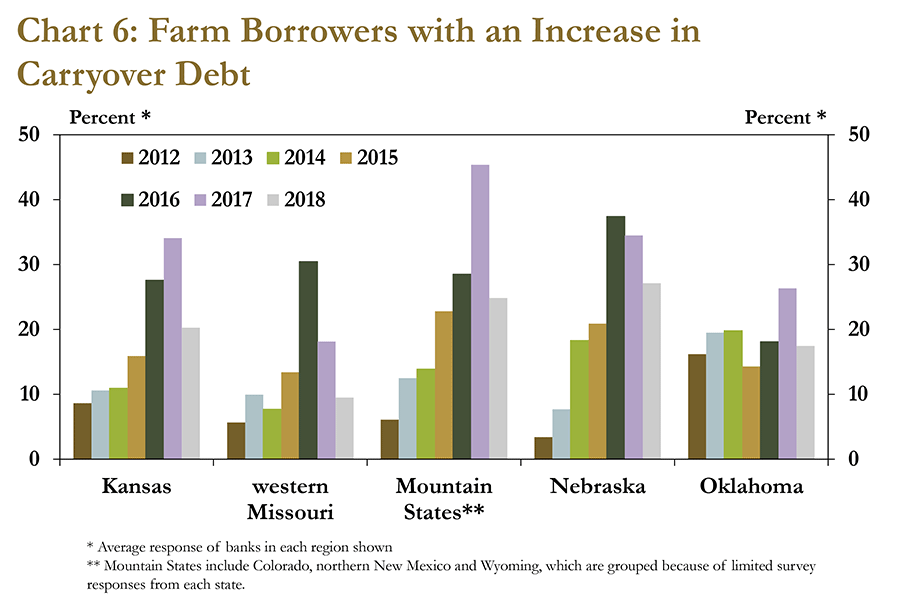
In addition, the amount of debt carried over from the previous year also continued to increase, but at a slower rate. Bankers in every state reported that slightly fewer farm borrowers had an increase in carryover debt compared with last year (Chart 6). However, carryover debt continued to increase for some farm borrowers in the midst of weak conditions throughout farm country. In Kansas, the Mountain States and Nebraska, the percent of farm borrowers with an increase in carryover debt remained higher than in 2015.
Lending Terms
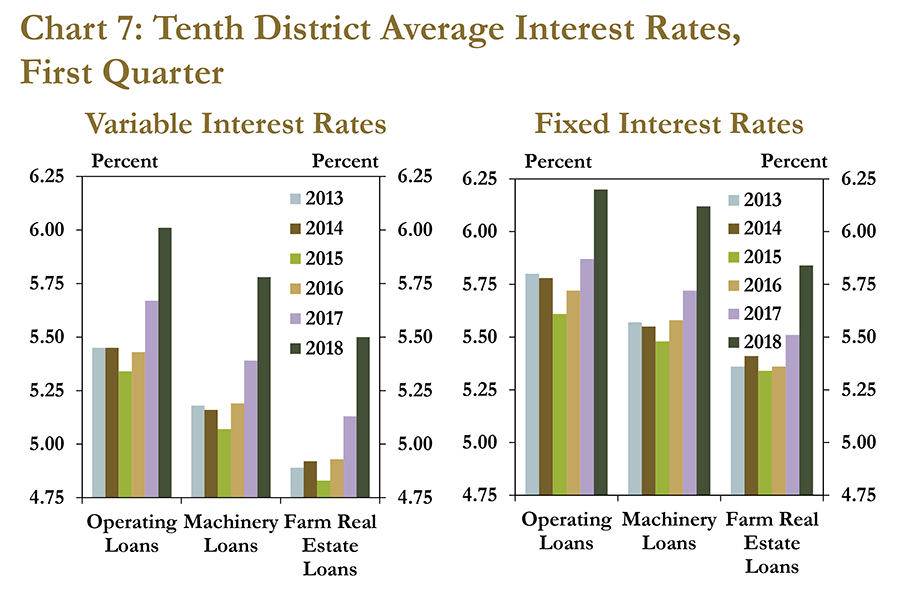
Interest rates continued to increase in the first quarter of the year. Average interest rates for fixed and variable rate loans have increased steadily since 2015 (Chart 7). Compared with 2017, however, interest rates rose relatively more sharply in 2018. Increasing interest rates alongside general increases in farm debt could mean that some farm borrowers may face slightly higher annual interest expenses and more difficulty repaying loans. Overall, however, the increase in expenses has remained relatively small, and delinquencies on farm loans have remained low.
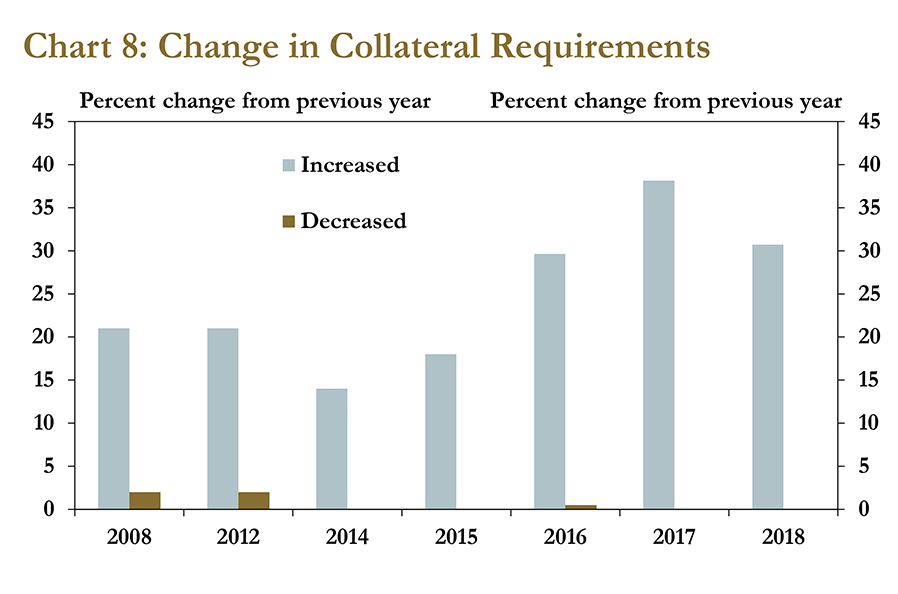
Alongside higher interest rates, collateral requirements continued to increase slightly. In fact, for the second consecutive year, no bankers reported decreased requirements for collateral (Chart 8). A majority of bankers reported that lending terms were unchanged, and fewer bankers reported increased requirements compared with last year. However, the continuing trend of increasing collateral requirements suggests that agricultural lenders are maintaining tight lending standards to curb risks that remain amid weaker levels of farm income and liquidity.
Farmland Values
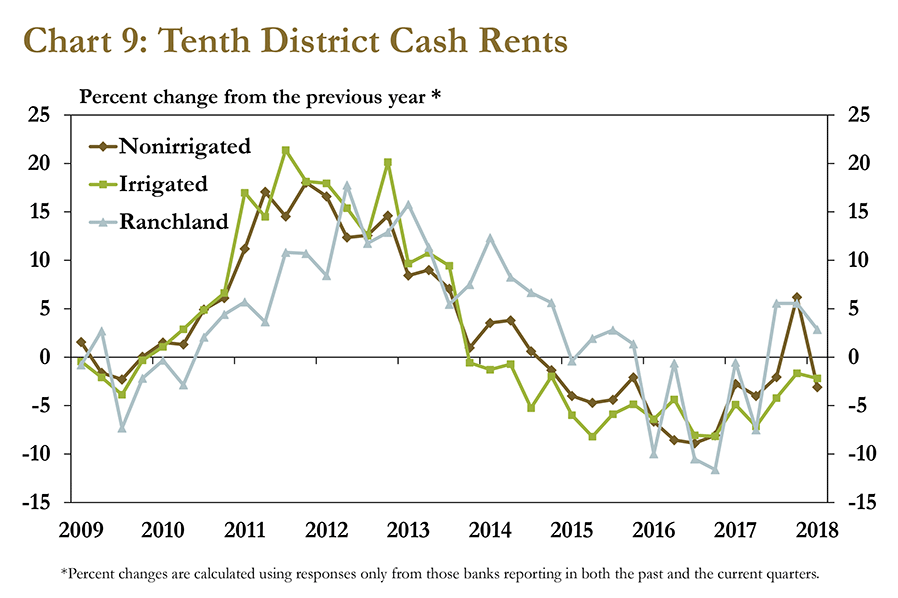
Despite risks that remain in the agricultural outlook, lower cash rental rates for non-irrigated and irrigated cropland could provide some relief on the expense side of the cash-flow statement. Cash rents for non-irrigated and irrigated cropland fell by about 3 percent in the first quarter of 2018 (Chart 9). Rental rates for ranchland increased for the third straight quarter, which has likely been due to relative strength in cattle prices. In fact, some bankers commented that operations with cattle had better returns than grain-only farms in 2017.
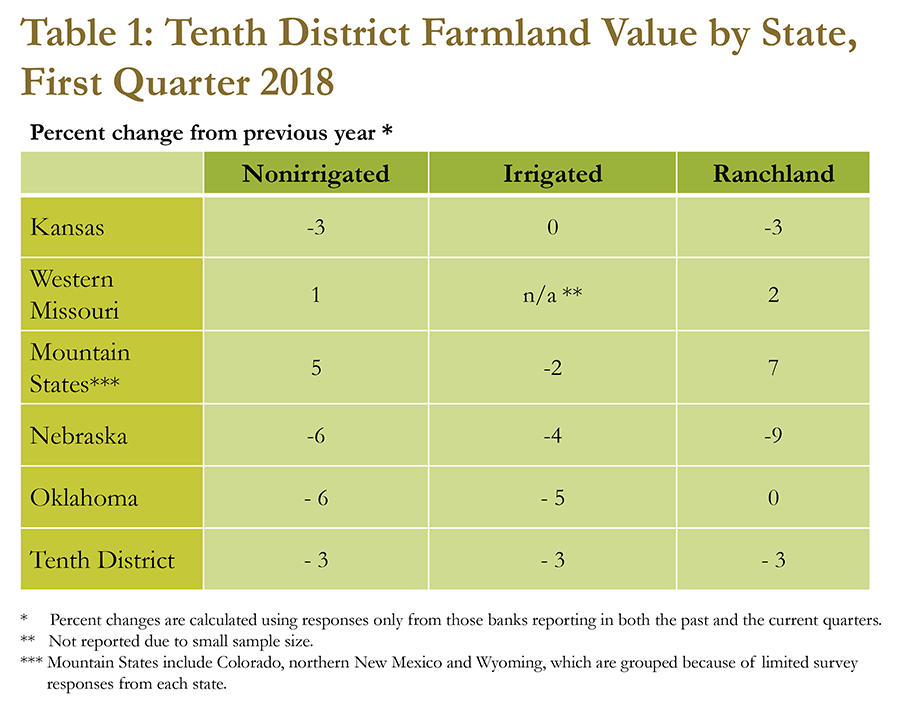
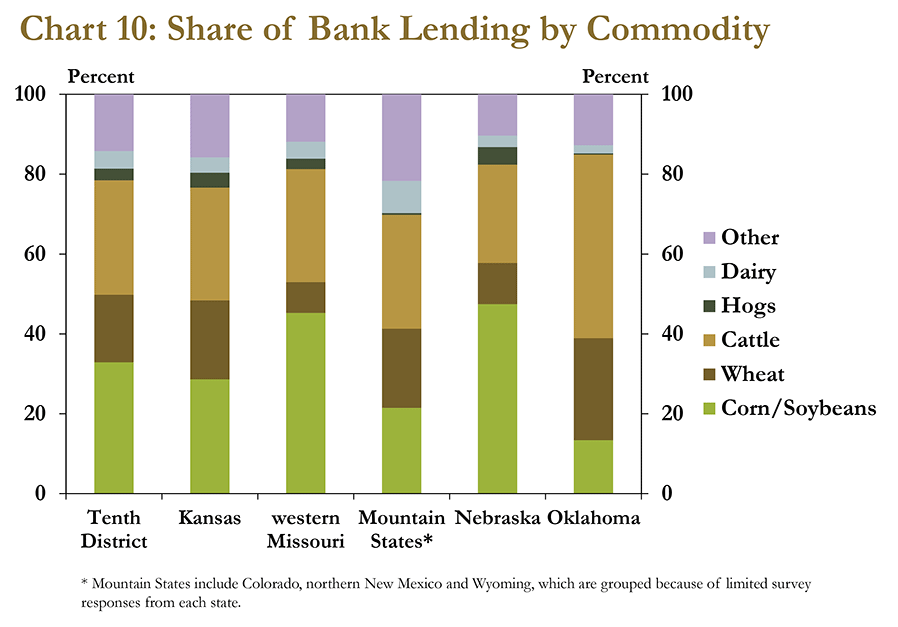
Similar to recent trends, District farmland values remained relatively stable. Compared with declines in farm income, declines in farmland values have remained modest. In the first quarter, values for all types of farm real estate declined by just 3 percent, on average (Table 1). In the mountain states and western Missouri, values for non-irrigated farmland and ranchland increased slightly. On the other hand, the largest declines in farm real estate values were in Nebraska, a state with the largest share of agricultural lending in corn and soybean production (Chart 10).
Conclusion
In the first quarter of 2018, bankers in the Tenth Federal Reserve District reported lower farm income and credit conditions for the fifth straight year. Weaker farm financial conditions continued to affect lending decisions and contributed to tighter lending standards. Bankers have responded to ongoing cash-flow concerns by restructuring debt, increasing or maintaining collateral requirements or – in some cases – denying loans. Higher interest rates could put additional pressure on cash flows, but moderate increases in crop prices and further declines in cropland rental rates could help improve profit margins of crop producers in the District in coming months.
_______________________________________________________________________
A total of 193 banks responded to the First Quarter Survey of Agricultural Credit Conditions in the Tenth Federal Reserve District—an area that includes Colorado, Kansas, Nebraska, Oklahoma, Wyoming, the northern half of New Mexico and the western third of Missouri. Please refer questions to External LinkCortney Cowley, economist at 1-800-333-1040.
The views expressed in this article are those of the authors and do not necessarily reflect the views of the Federal Reserve Bank of Kansas City or the Federal Reserve System.
Authors

Cortney Cowley
Assistant Vice President and Oklahoma City Branch Executive