Farm loan demand remained muted at commercial banks in the first quarter of 2021. A reduction in the volume of operating loans led to an overall decline in total non-real estate lending. Financing activity also declined more notably at banks with relatively large farm loan portfolios, while lending was more stable among small and mid-size lenders.
Factors specific to the pandemic in 2020 likely contributed to the reduced lending activity as the year progressed. Substantial government aid through various programs in 2020 provided financial support, which may have mitigated some producers’ financing needs toward the end of the year. In addition, the Small Business Administration’s Paycheck Protection Program accounted for a sizable share of loans reported, and likely displaced a portion of typical financing needs for some borrowers.
Despite some ongoing challenges for cattle producers, financial conditions in agriculture remained favorable alongside strength in other major agricultural commodity markets. The outlook for the sector in 2021 remained significantly improved from recent years, but rising input costs could also weigh on profit margins in the months ahead.
First Quarter National Survey of Terms of Lending to Farmers
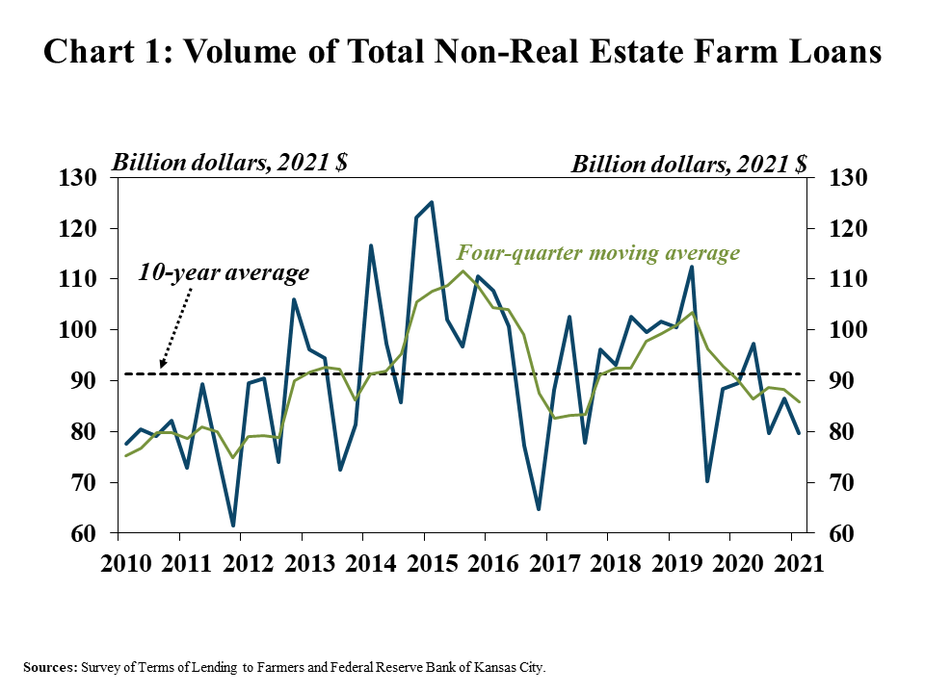
Agricultural lending activity at commercial banks declined at a measured pace in the first quarter, according to the National Survey of Terms of Lending to Farmers._ The total volume of non-real estate farm loans was about 10% less than a year ago, continuing a recent trend of reduced loan demand (Chart 1). Lending has tracked below the recent historical average on a rolling four quarter basis since the beginning of 2020 and declined at an average pace of about 4% over that time.
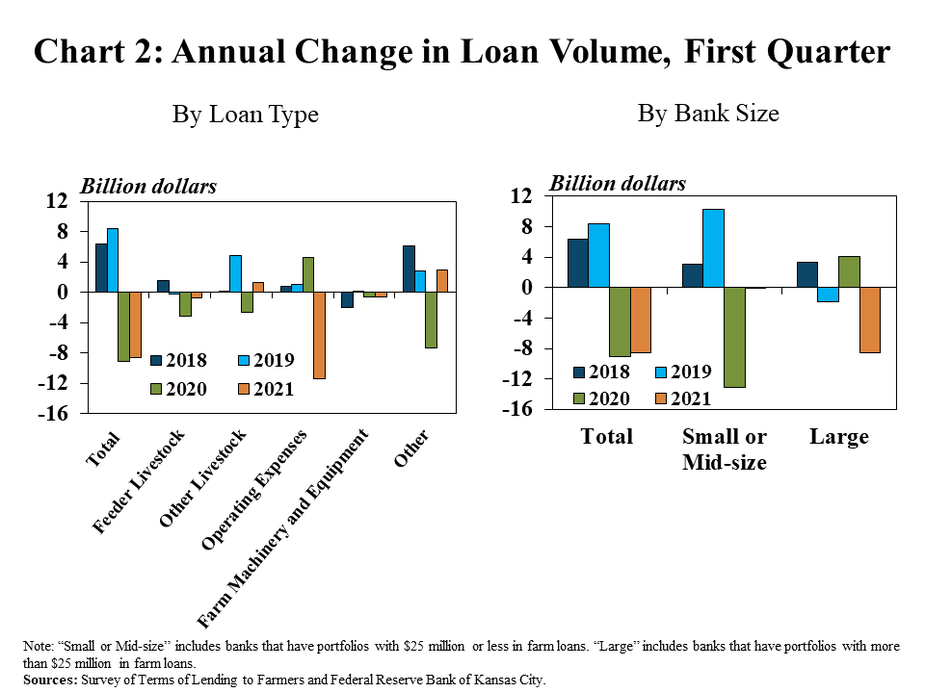
Reduced demand for loans to finance operating expenses drove the overall decline in non-real estate financing. Operating loans decreased by about $12 billion from a year ago, which represented nearly all of the drop in non-real estate farm lending (Chart 2). Large commercial banks also accounted for most of the decline from a year earlier. Loan volumes fell by nearly 14% at large banks, compared with a decrease of less than 1% at banks with smaller portfolios._
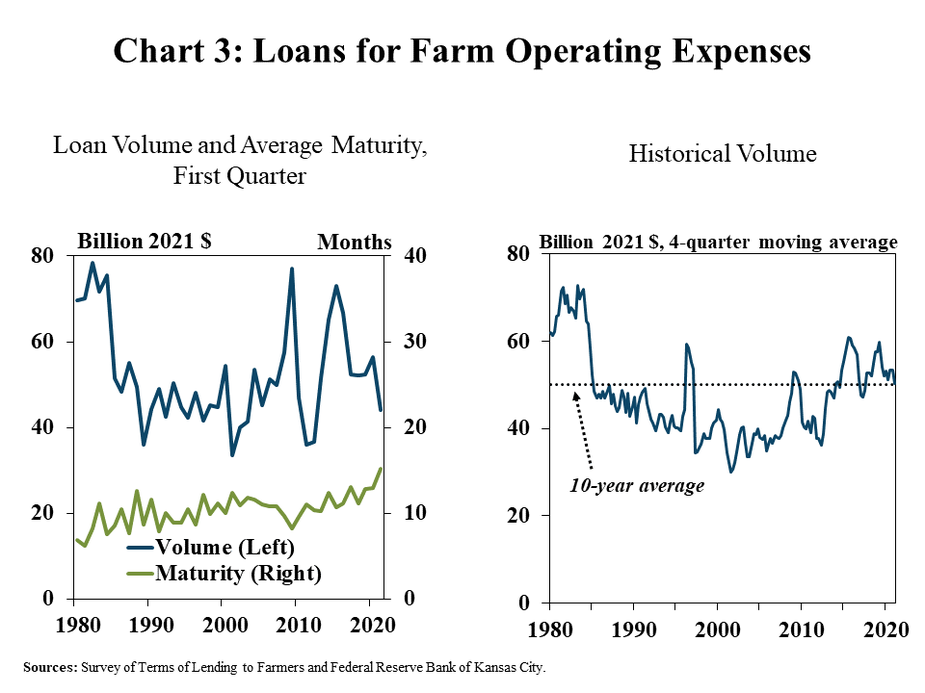
In addition to a contraction in new operating debt, bankers booked loans with historically long durations. The amount of new operating debt declined to the lowest level for the first quarter since 2012, while the average maturity of those loans was the highest for any quarter on record (Chart 3). With a decline of about 20% from a year ago, operating loan volume retreated to the average of the past ten years on a rolling four-quarter basis.
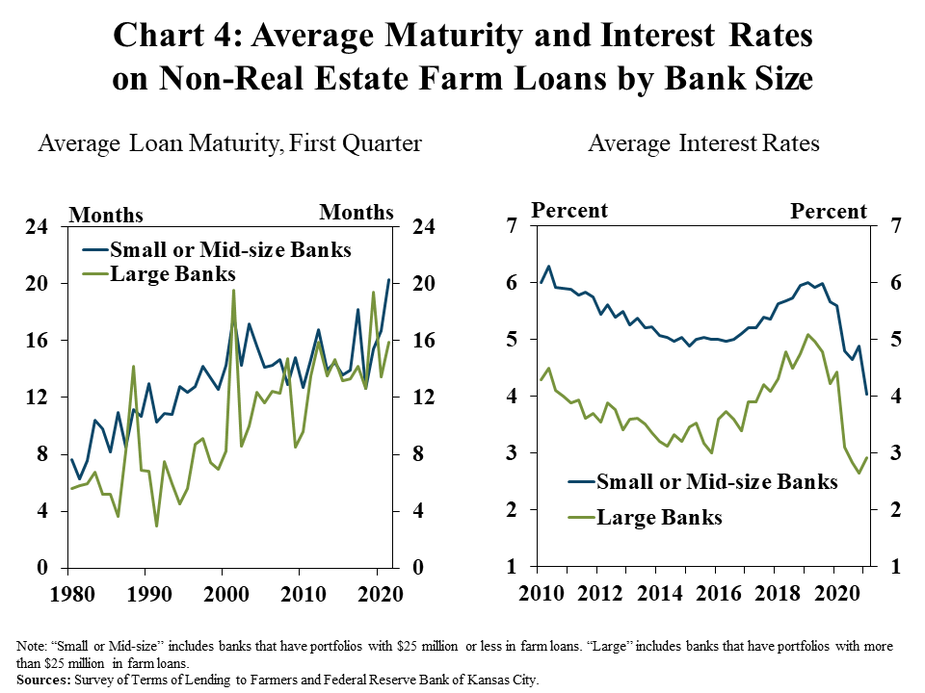
Small agricultural banks drove the expanded length of loan maturities and cut interest rates at a faster pace than larger lenders. The average maturity of all non-real estate loans made by small or mid-size banks increased by more than 3.5 months from a year ago and reached a historic high (Chart 4). In addition, the average interest rate on loans made by those same lenders declined at a faster pace than in previous quarters. [2]
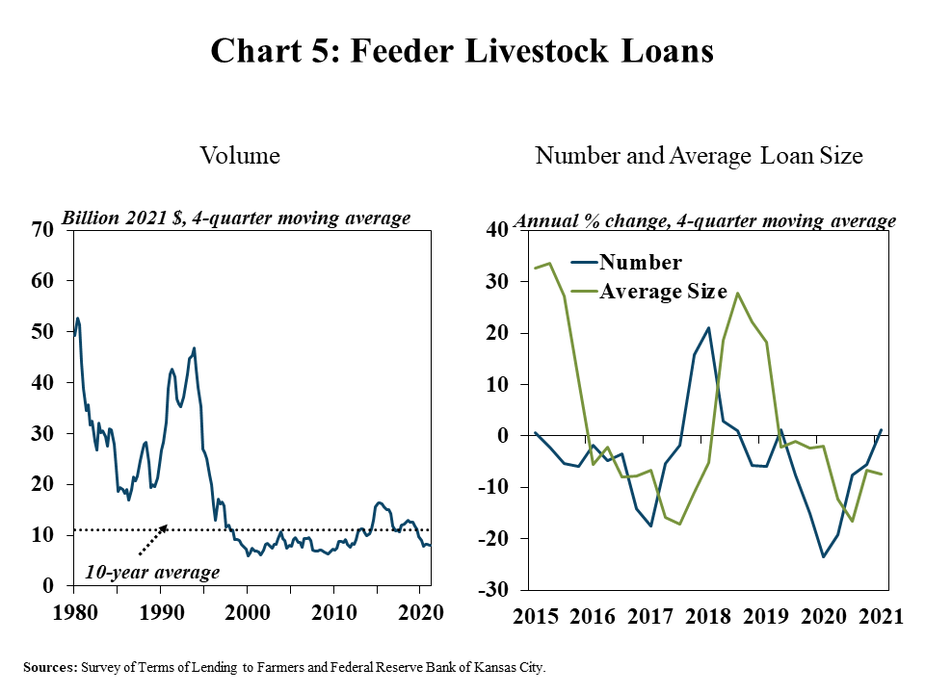
Alongside ongoing challenges in the cattle sector related to limited profits and severe drought in some regions, the slowdown in financing for livestock in the first quarter was also notable. The volume of loans for feeder livestock decreased about 11% from a year ago and remained well below the average of the past ten years (Chart 5). There were a similar number of new feeder livestock loans compared with last year, however; the average size of those loans continued to decline.
Data and Information
National Survey of Terms of Lending to Farmers Historical Data
Endnotes
-
1 Loans made as part of the Small Business Administration (SBA) Paycheck Protection Program (PPP) and reported by banks in the Survey of Terms of Lending to Farmers are excluded from all data calculations.
-
2 “Small or Mid-size” includes banks that have portfolios with $25 million or less in farm loans. “Large” includes banks that have portfolios with more than $25 million in farm loans. Based on Call Report information as of December 31, 2020, the panel of banks participating in the Q1 2021 Survey of Terms of Lending was 45% “Small or mid-size” banks and 55% “Large” banks.
The views expressed are those of the authors and do not necessarily reflect the positions of the Federal Reserve Bank of Kansas City or the Federal Reserve System.
Authors

Nate Kauffman
Senior Vice President, Economist, and Omaha Branch Executive; Executive Director of the Center for Agriculture and the Economy
