Farm debt at commercial banks grew at a steady pace in the first quarter and loan performance improved gradually. The rise in benchmark interest rates over the past year supported considerable growth to interest income that boosted earnings, but higher funding costs have curbed net interest margins in recent months. Like other commercial banks, the rapid rise in interest rates at agricultural banks also has pushed unrealized losses on securities holdings to very high levels. Through the first quarter, sound liquidity eased some of the ongoing risks and continued to support the ability of farm lenders to meet credit demands.
The outlook for the U.S. farm economy has moderated in recent months, but farm finances remained solid with support from historically strong incomes in recent years. The prices of several major commodities have contracted in recent months and tempered profit opportunities for many producers. Higher production costs have pushed up credit needs for some borrowers, while many others have utilized cash holdings to supplement loan balances and reduce interest expenses. Strong borrower liquidity also has supported loan performance and kept delinquency rates at historically low levels.
Outstanding Farm Loans and Delinquency Rates
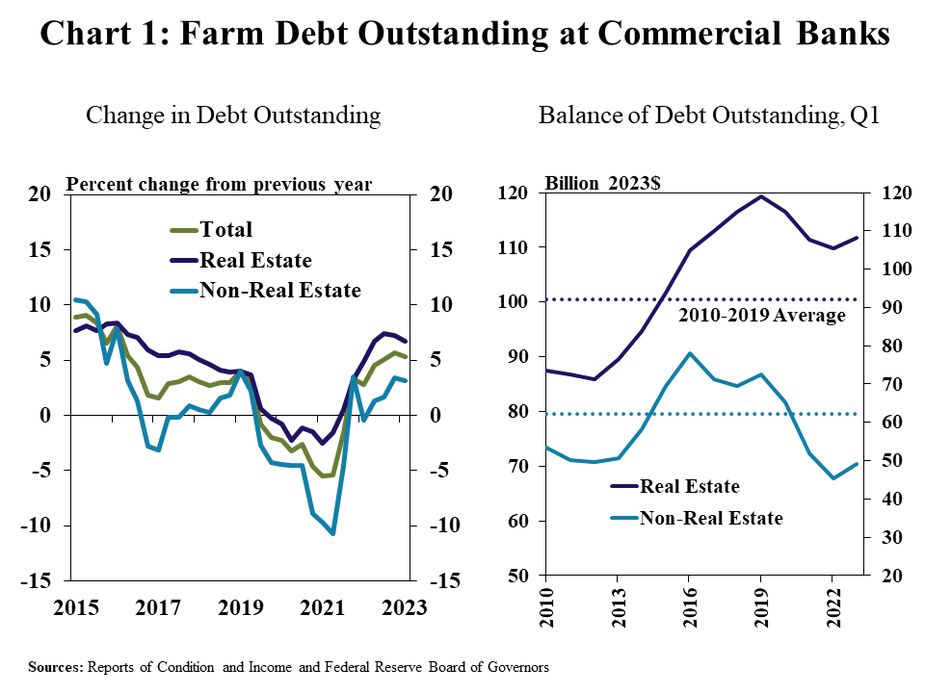
Farm debt at commercial banks grew steadily in the first quarter. Real estate and non-real estate farm loan balances increased 7% and 3%, respectively, from a year ago, which was similar to recent quarters (Chart 1, left panel). The rebound pushed non-real estate debt balances up from multi-year lows a year ago, and real estate debt remained elevated at just 6% less than the all-time high of $119 billion in 2019 (Chart 1, right panel).
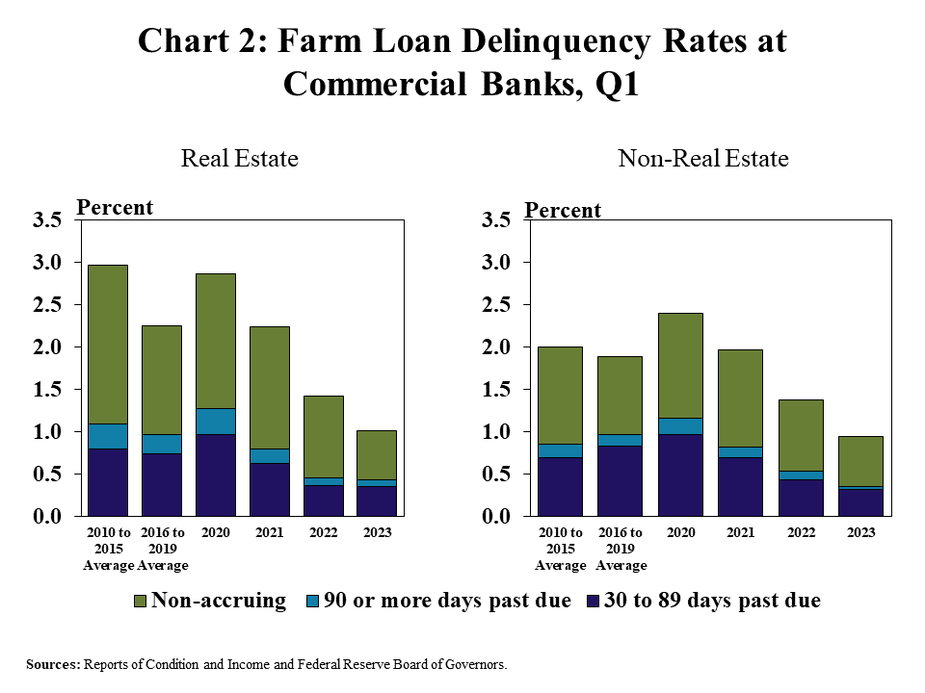
Strong conditions in the farm economy continued to support solid loan performance. The rate of delinquency on both real estate and non-real estate loans dropped for the third consecutive year to just 1% in the first quarter (Chart 2). The decline in delinquency rates over the past year was largely due to a reduction in non-accruing loan balances, signifying a broad degree of strength in farm finances and repayment capacity.
Earnings Performance at Agricultural Banks
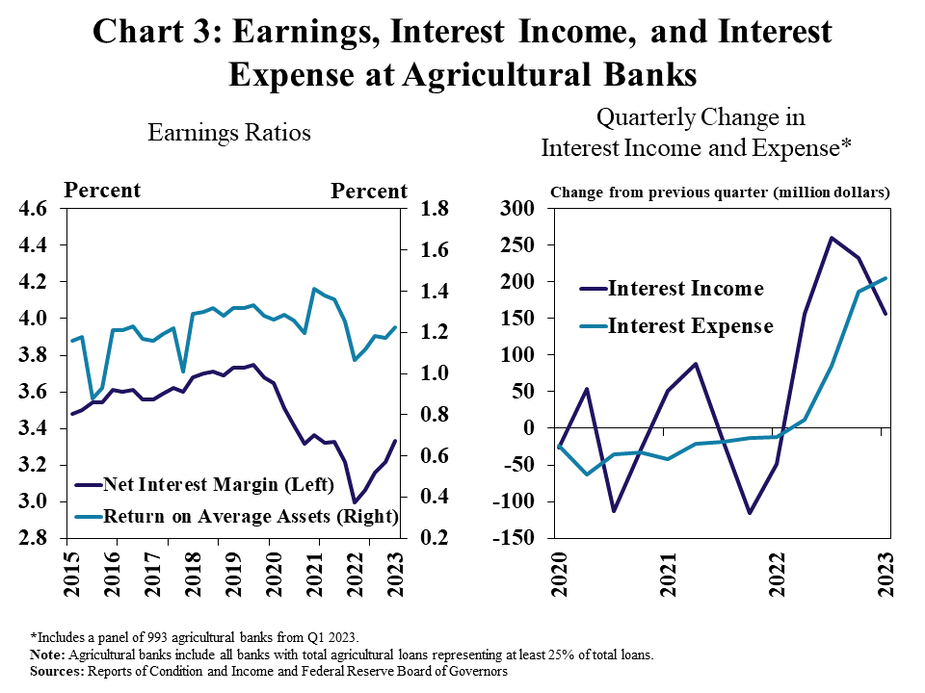
Interest margins increased alongside higher benchmark rates, but costs of funding have also risen in recent quarters. On an annualized basis, the net interest margin at agricultural banks increased to more than 3%, the highest level since early 2021, and returns on average assets also increased (Chart 3, left panel). In contrast to recent periods, the increase in interest expenses in the first quarter was larger than the growth in interest income and could reduce net interest margins in the months ahead.
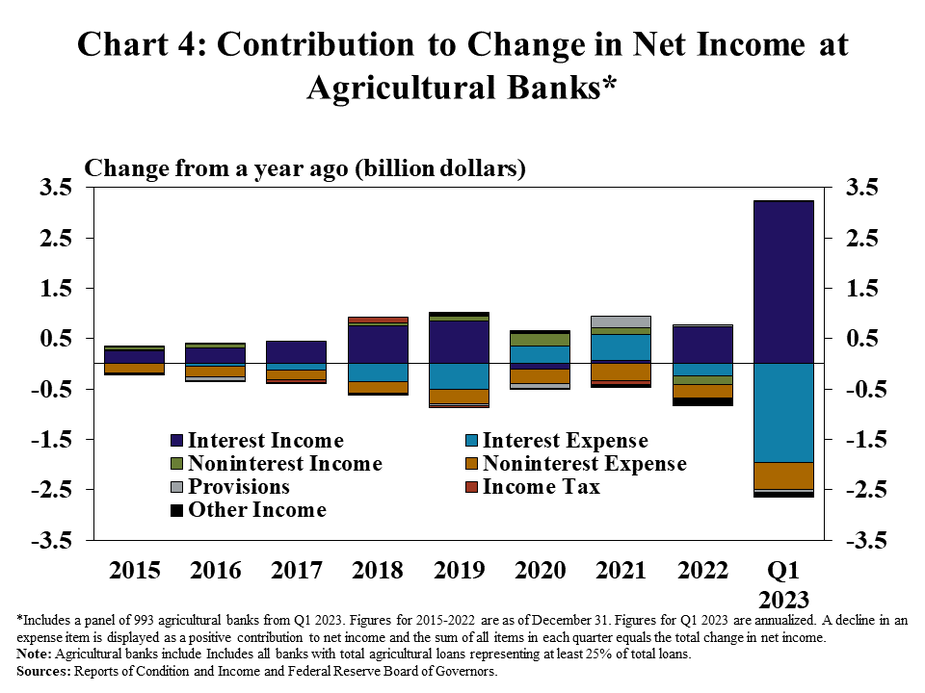
Despite an uptick in funding costs, growth in interest income over the past year was strong and has supported bank profits. The 300% increase in annualized interest income in the first quarter of 2023 more than offset a rise in all categories of expenses (Chart 4). Compared with 2022, growth in income from interest was 65% more than the increase in interest expenses, but that gap could narrow with a faster increase in funding costs in recent months.
Capital and Liquidity at Agricultural Banks
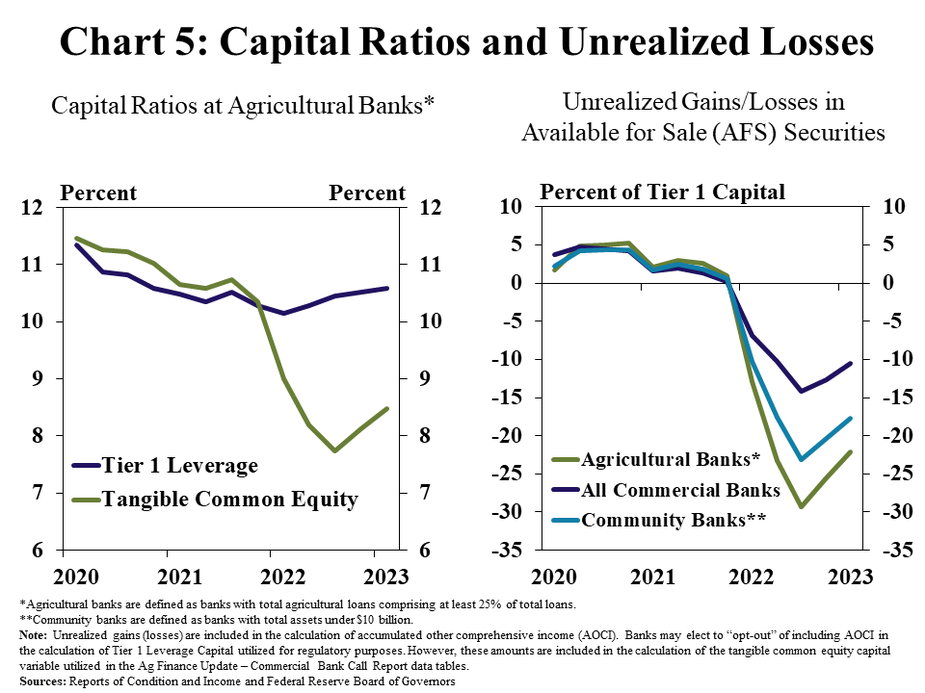
Capital ratios improved slightly alongside earnings, but unrealized losses remained elevated in the first quarter. The tangible common equity ratio_ remained low at agricultural banks but increased from a historic low reached in 2022. Also, the Tier 1 leverage ratio, which measures Tier 1 capital _ to average assets, continued to improve and has increased every quarter over the past four quarters (Chart 5). The level of unrealized losses improved slightly but remains high and represented a comparably higher share of capital at agricultural banks than other lenders.
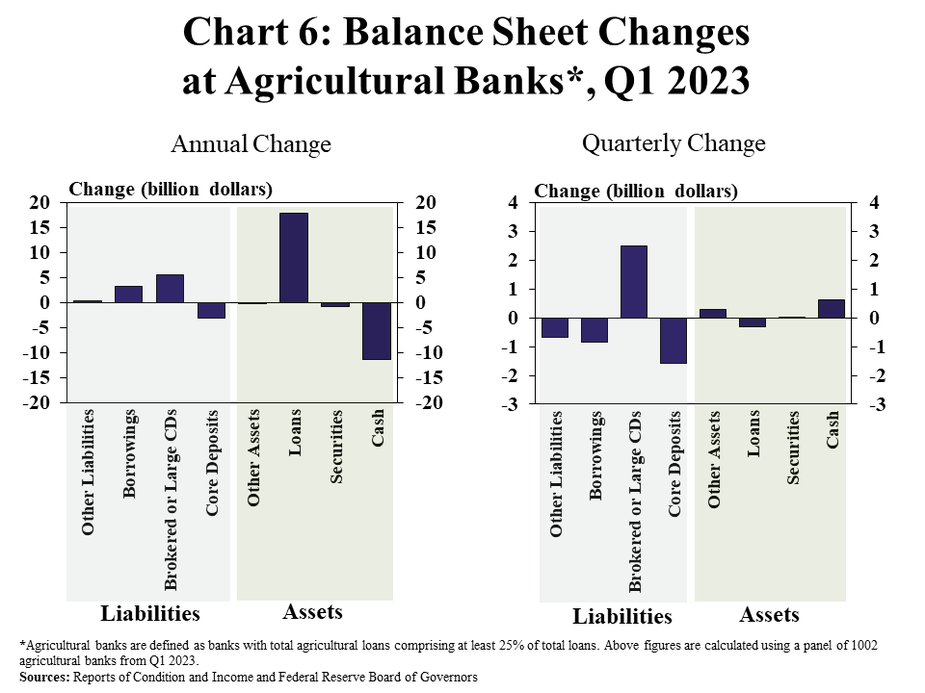
The scale of unrealized losses and financial stress for some lenders has led to heightened risk management across the banking sector, resulting in some changes in balance sheets at agricultural banks. Over the past year, agricultural banks primarily funded strong loan growth through cash holdings and utilized brokered deposits, large time deposits, and other borrowings to a lesser degree (Chart 6, left panel). In the first quarter of 2023, industry-wide liquidity pressures caused a broad pullback in lending. Agricultural banks boosted cash reserves with brokered and large time deposits, while core deposits declined slightly (Chart 6, right panel).
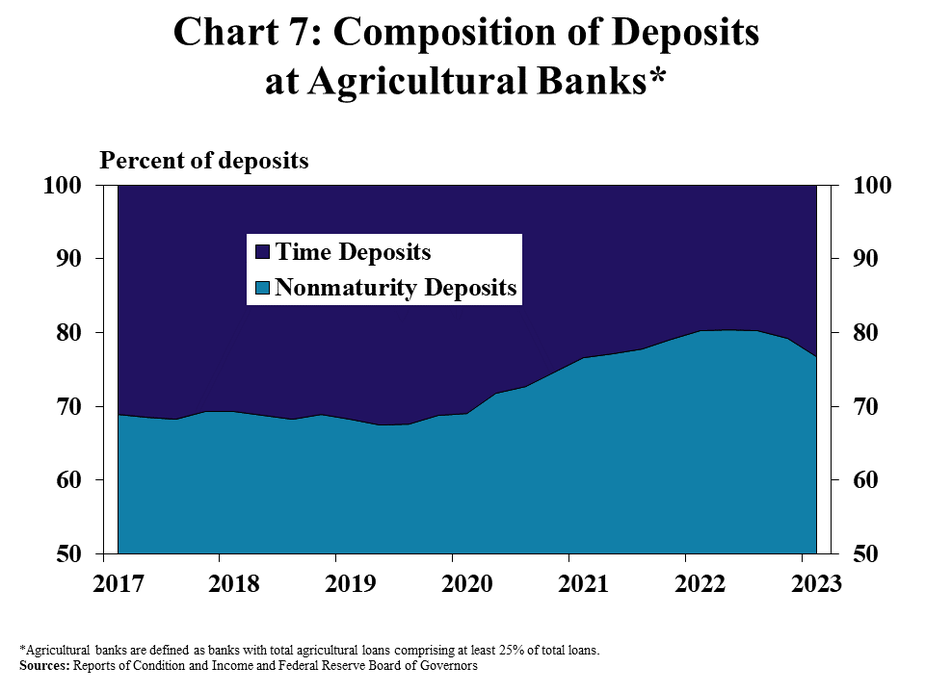
The composition of deposits at agricultural banks has also changed with the higher interest rate environment. Following a sharp influx of non-maturity deposits (or demand deposits) in 2021 and 2022, the share of deposits held in longer-term time deposits (or CDs) has increased in recent quarters (Chart 7). As the rate paid on deposits has increased with higher benchmark rates, demand for higher paying time deposit accounts has increased, reverting toward recent historical norms.
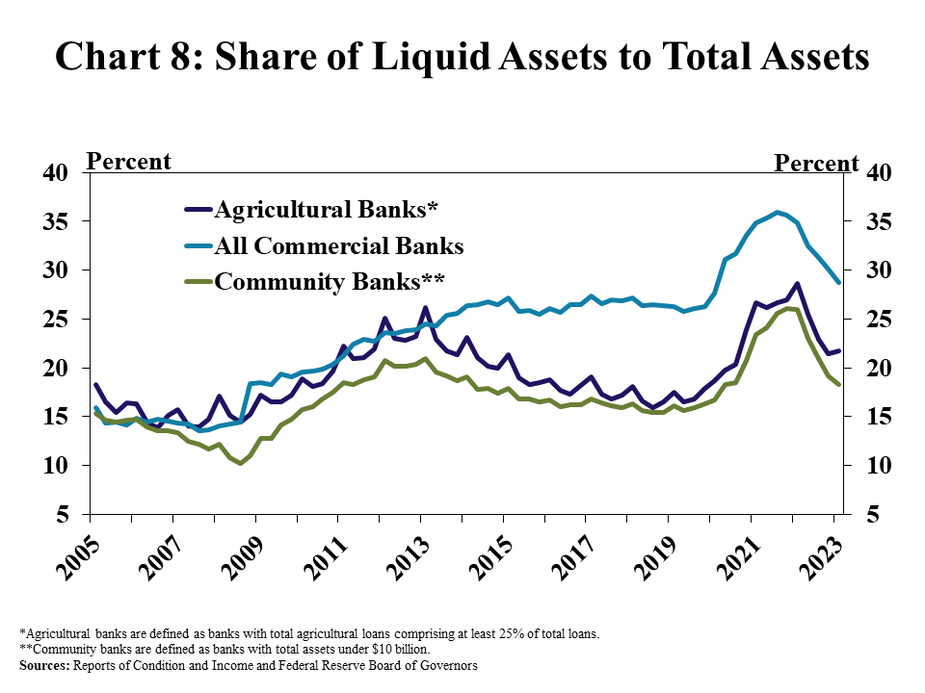
Despite some changes in composition, liquidity at agricultural banks remained strong and mitigated some of the risks associated with the high levels of unrealized losses. The share of liquid assets as a percent of total assets at agricultural banks has declined slightly over the past year but remained at a historically high level following a considerable buildup in 2021 and 2022 (Chart 8). Historically, agricultural banks also have held a slightly higher share of liquid assets than non-agricultural banks of a similar size, and that trend persisted in the first quarter.
Endnotes
-
1
Tangible Common Equity is calculated as total equity capital less goodwill, other intangible assets, and mortgage servicing assets deducted in Call Report Schedule RC-R as a percentage of average assets less goodwill, other intangible assets, and mortgage servicing assets deducted in Call Report Schedule RC-R.
-
2
Tier 1 capital is a regulatory capital measure that makes certain adjustments to bank stockholder equity.