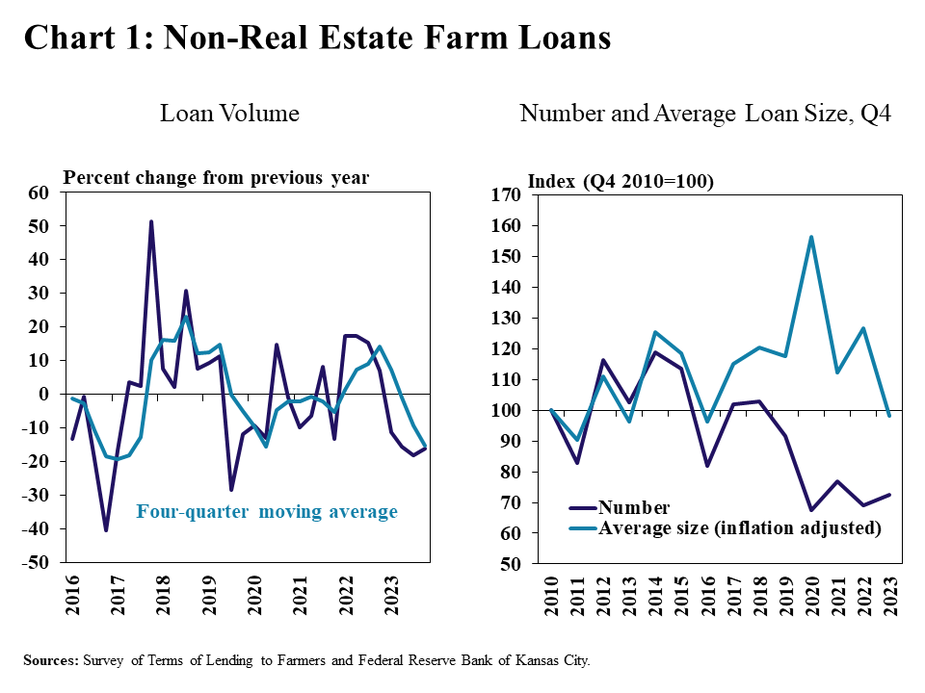
New non-real estate farm lending activity at commercial banks continued to decline in the fourth quarter. According to the Survey of Terms of Lending to Farmers, the volume of new non-real estate farm loans was about 15% less than a year ago during the final months of 2023. The number of new loans increased from a year ago, but average loan sizes were notably lower. The sharp climb in farm loan interest rates abated during the quarter as average rates increased modestly for some types of loans and dropped slightly for others.
Despite a reduction in new loans made over the past year, outstanding farm debt balances reported by commercial banks grew steadily through the third quarter of 2023. Many lenders continued to report subdued demand for farm loans, while others highlighted growing demand. Elevated production costs, higher interest expenses and lower commodity prices have increased financing needs of many producers, however, strong liquidity built up in recent years likely supplemented borrowing needs of some operations throughout the year.
Fourth Quarter National Survey of Terms of Lending to Farmers
Agricultural lending activity slowed at a swift pace over the past year. The volume of new non-real estate farm loans at commercials banks declined for the fourth consecutive quarter and was about 15% less than a year ago (Chart 1, left panel). The number of new loans was slightly higher than a year ago, but the average loan size adjusted for inflation was the lowest since 2017 (Chart 1, right panel).
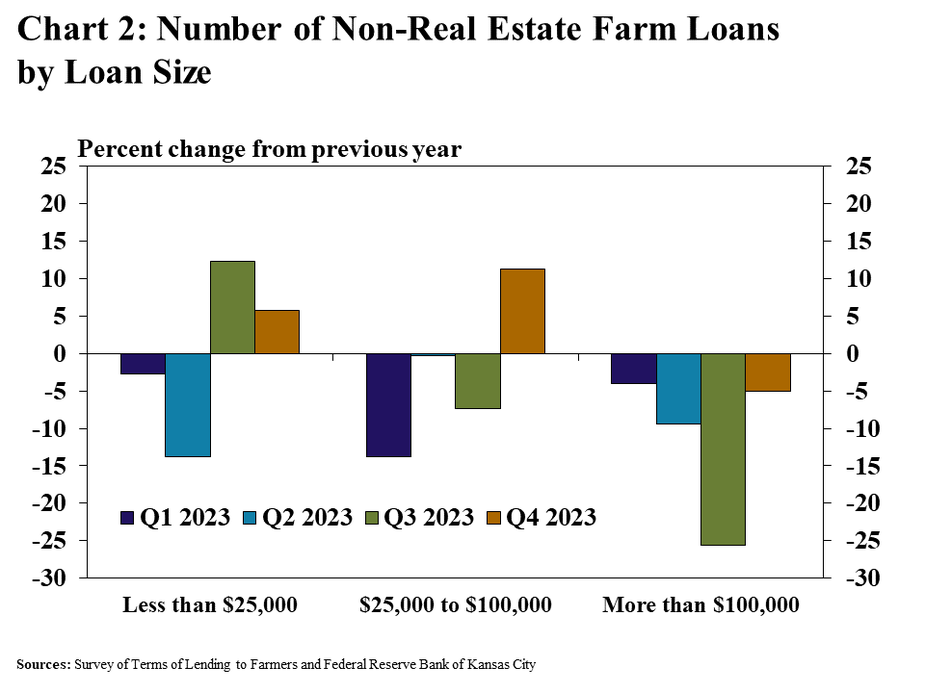
The number of smaller notes increased at the end of 2023, but the number of larger notes continued to drop through the end of the year. Compared with this time last year, there were 8% more loans that were smaller than $100,000 (Chart 2). There were 5% fewer loans larger $100,000, the fourth consecutive quarter of decline in the number of larger notes.
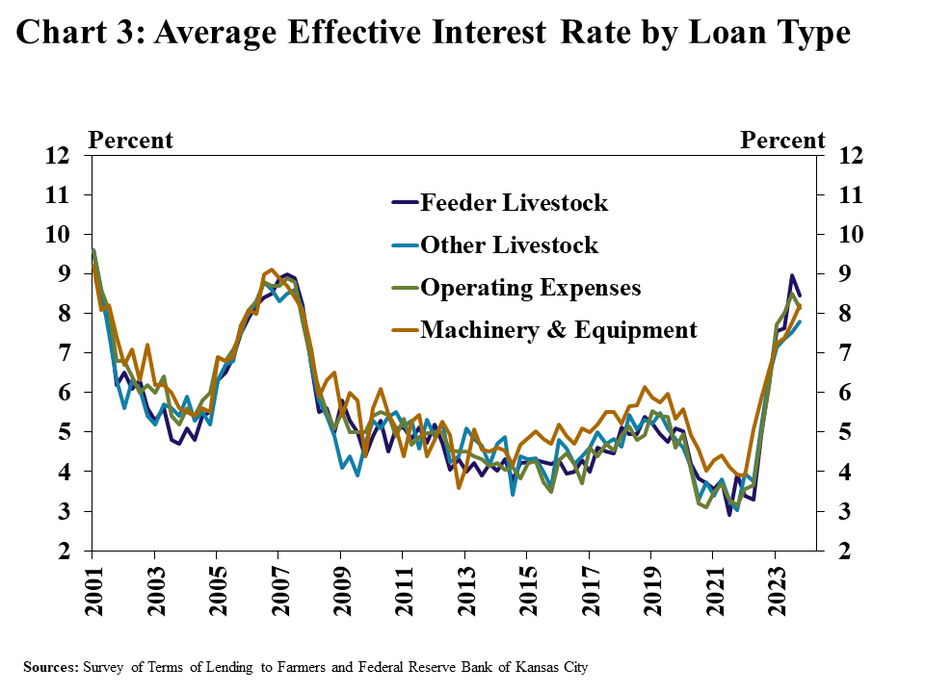
Lending activity has softened alongside a rapid rise in financing costs over the past year, but rates steadied for some types of loans in the fourth quarter. The average rate charged on feeder livestock and operating loans dropped about 50 basis points from the previous quarter as benchmark rates remained steady in recent months (Chart 3). The average rate on loans for other livestock and machinery edged slightly higher.
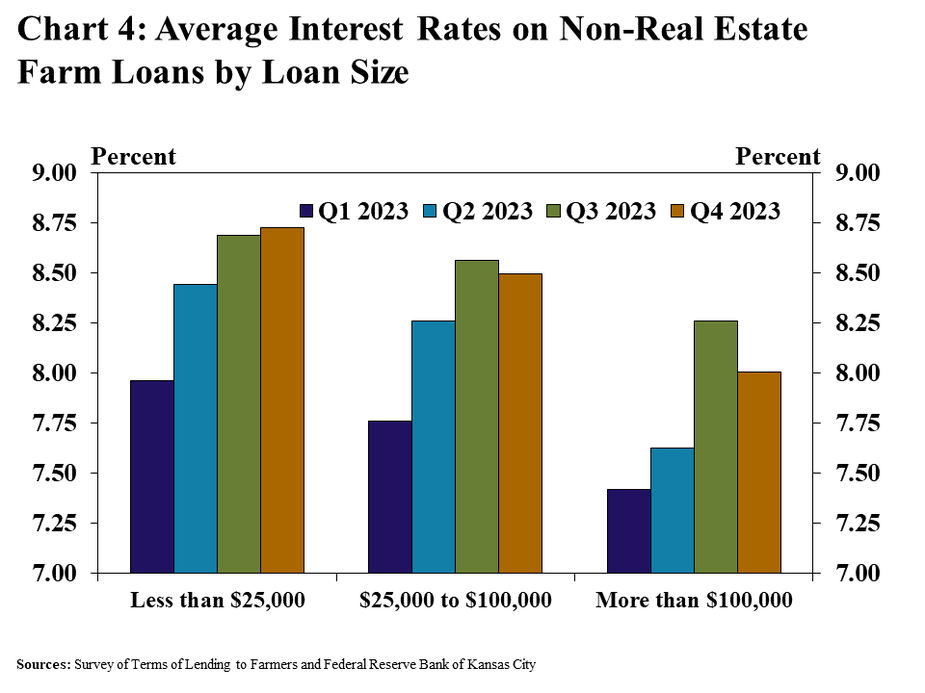
As 2023 ended, average rates inched slightly higher on smaller loans while tapering slightly for larger notes. The average rate charged on loans for less than $25,000 was slightly higher than the previous quarter, increasing for the seventh consecutive period (Chart 4). The climb in average rates abated for larger sized loans, dropping about 10 and 25 basis points for loans between $25,000 to $100,000 and larger than $100,000, respectively.
Data and Information
Excel SpreadsheetNational Survey of Terms of Lending to Farmers Historical Data
Excel SpreadsheetNational Survey of Terms of Lending to Farmers Tables
txtAbout the National Survey of Terms of Lending to Farmers
The views expressed are those of the authors and do not necessarily reflect the positions of the Federal Reserve Bank of Kansas City or the Federal Reserve System.