Oklahoma saw a large inflow of new residents in each of the past three years, resulting in the state’s largest population increases since 2013. The previous edition of the Oklahoma Economist discovered those moving in came mostly from the Western U.S., and the state experienced “brain gain” after losing college graduates to other states for many years. This edition explores where in Oklahoma these new residents moved to and where other residents have moved within the state, as well as the demographics and employment status of those moving in. It finds that most places in the state gained people on net, but the Oklahoma City and Tulsa Metropolitan Statistical Areas (MSAs) had the most growth. Additionally, over half of the new residents are working age and employed across a wide range of industries and occupations with a broad variety of incomes and credit scores. Finally, while remote workers contributed to the in-migration, they were not its primary driver.
Most areas of the state gained new residents, especially suburban counties
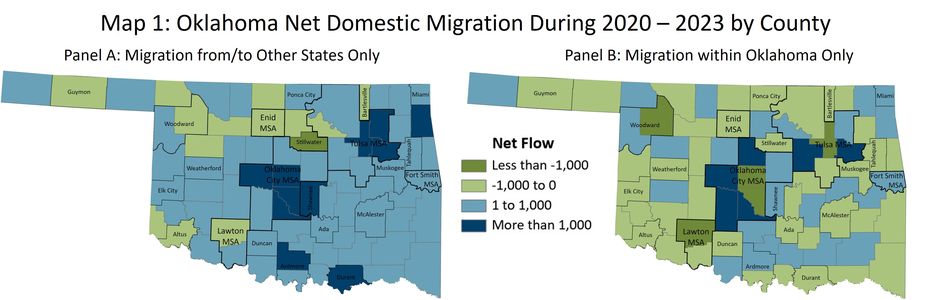
The COVID-19 pandemic spurred a surge of migration from the nation’s largest metropolitan areas to affordable large and midsized metro areas, and also to smaller metro and rural areas (Whitaker 2023)._ The state of Oklahoma was no exception to this trend. Nearly 85% of Oklahoma’s 77 counties gained more residents than they lost to other states since the pandemic (Map 1, Panel A)._ Tulsa and Oklahoma counties had the highest gains at 8,700 and 6,300, respectively, while Canadian County in the OKC MSA and Rogers and Wagoner counties in the Tulsa MSA each added 2,000-3,000 new residents on net. Oklahoma City’s Cleveland and McClain counties as well as Durant, Shawnee, Ardmore, and Delaware County received more than 1,000 new residents from other states during this time.
Note: Sample is limited to age 25+.
Source: FRBNY Consumer Credit Panel/Equifax, authors’ calculations
Of course, people also move to different areas within states. In fact, the pandemic accelerated migration of high-income individuals from the nation’s city centers to suburban neighborhoods within metropolitan areas as more people worked from home (Li & Su 2023)._ Oklahoma City’s core county, Oklahoma County, lost more residents to other parts of the state (over 7,000) than it gained from other states since 2020 (Map 1, Panel B). Canadian County—the westernmost county in the OKC metro—grew the most during the pandemic by far, adding more than 11,000 residents on net from inside and outside the state, while McClain County on the southern end of the metro netted nearly 3,900 new residents. Although Tulsa County—the core county of the Tulsa MSA—had a positive overall gain of residents due to growth from other states, it also lost around 5,700 residents to other counties in the state. However, Wagoner County—the area’s easternmost county—added the most in the metro with a total net gain of 6,700, while Rogers County gained around 3,000 on net and Creek County netted close to 1,800. Thus, counties outside the urban core had the largest growth in both metro areas.
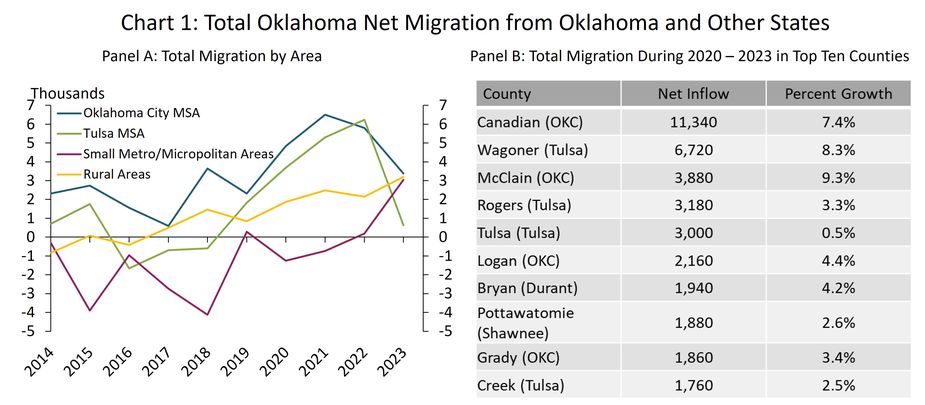
The Oklahoma City and Tulsa MSAs saw the highest levels of total net migration (both from within Oklahoma and from other states), but in-migration also picked up in the state’s small metro/micropolitan areas and rural areas. Net migration to the two large metros soared from 2020 to 2022, with Oklahoma City’s net gain peaking in 2021 at 6,500 people and Tulsa’s peaking in 2022 at around 6,200 (Chart 1, Panel A). Four of the top ten counties in the state for net migration were in the OKC MSA, and another four were in the Tulsa MSA (Chart 1, Panel B). Since their respective peaks, migration has slowed in the metro areas. This may be due to migration out of the nation’s largest metros to midsized metros slowing to their pre-pandemic trends (Whitaker 2023). Even so, net in-migration picked up in 2023 in Oklahoma’s small metropolitan and micropolitan areas and its rural areas despite the slowing in OKC and Tulsa._
Note: Sample is limited to age 25+.
Source: FRBNY Consumer Credit Panel/Equifax, U.S. Census Bureau, authors’ calculations
The counties with total net migration losses were primarily concentrated in the small metro/micropolitan areas and rural counties in Western Oklahoma. The state’s small metropolitan and micropolitan areas had a net gain of residents from other states but lost more residents to Oklahoma City up until 2023. The Oklahoma City metro received around 1,000-2,000 people most years since 2014 from the state’s smaller metros and micropolitan areas, accounting for around 30% of its total migration gains since 2020. By contrast, nearly all the Tulsa area’s gains were from previously out-of-state residents and few from within the state.
Most new residents are working age and employed in Oklahoma
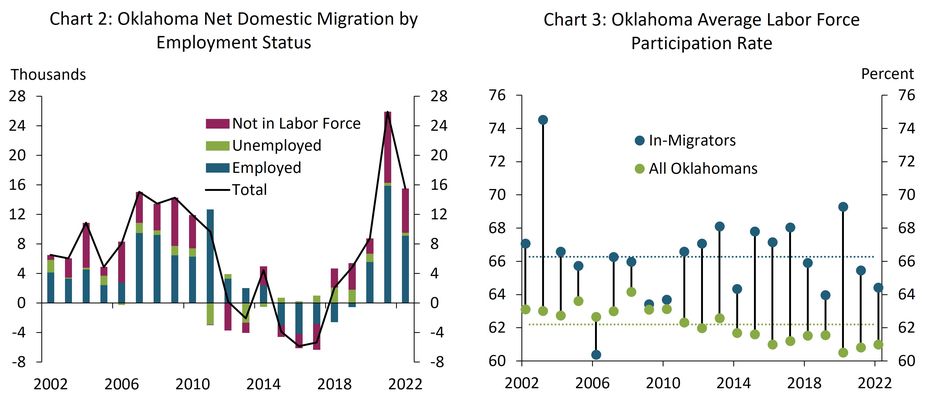
Most of the residents the state added since the pandemic are working and very few are unemployed. Oklahoma netted over 30,500 employed residents since 2020, far exceeding the cumulative loss of about 17,000 employed residents from 2015 to 2019 (Chart 2). Thus, this surge of migration added jobs in the state. The labor force participation rate of people moving into Oklahoma is also consistently higher than the state average (Chart 3)._ Over the past 20 years, the average labor force participation rate of those moving in is about 66%, 4 percentage points higher than the state average of 62%. Since 2020, participation among in-migrators has stayed at least 3.5 percentage points higher. This means that Oklahoma’s new residents have slightly increased the state’s labor force participation rate.
Note: Sample is limited to those age 25+ who reported employment status. Dotted lines in Chart 3 indicate average rates.
Sources: ACS 1-year estimates/IPUMS USA, University of Minnesota, www.ipums.org, authors’ calculations
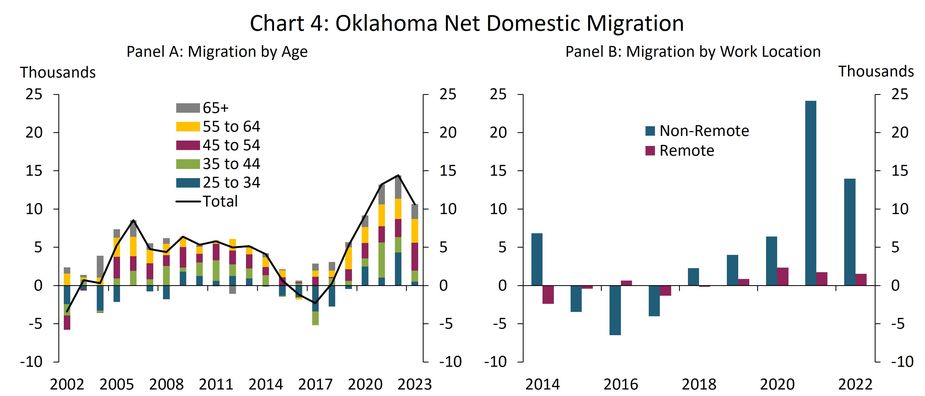
Many of Oklahoma’s new residents since the pandemic are under the age of 45 and over half are working age, reversing some previous trends. From 2015 to 2019, nearly all the small amount of in-migration the state had was driven by those over the age of 45 (Chart 4, Panel A). Since 2020, however, nearly 60% of Oklahoma’s migrants on net were between ages 25 to 54. Further, almost 40% of the state’s net new residents were between the age of 25 and 44, reversing some previous losses in this age group. During this time, Oklahoma had a net gain of over 8,000 25- to 34-years-olds, over 9,000 35- to 44-year-olds, and over 10,000 45- to 54-year-olds.
Note: Sample is limited to age 25+.
Sources: FRBNY Consumer Credit Panel/Equifax, ACS 1-year estimates/IPUMS USA, University of Minnesota, www.ipums.org, authors’ calculations
Most of the employed workers who moved to the state also work in the state. While Oklahoma saw a net increase of remote workers moving in during the pandemic, they were not the primary driver of domestic in-migration. A remote worker is defined as someone whose place of work is not in Oklahoma. In 2020, the state added around 2,300 remote workers on net, accounting for 42% of the net 5,500 employed individuals who arrived that year and 27% of all new residents (Chart 4, Panel B). But when in-migration soared in 2021, remote workers only made up 1,750 of the net 25,900 migrants, and only 1,500 of the net 15,500 in 2022. Thus, remote workers accounted for 11% of the total net in-migration from 2020 to 2022.
Additionally, the state gained residents in nearly every racial group, although the net number of Black residents was slightly negative since 2020. The majority of the state’s new residents are non-Hispanic white, but Oklahoma also had a net overall gain of Hispanic and non-white residents from 2020 to 2022.
The state gained workers in all industries and occupations, and stopped losing high earners
Oklahoma’s recent influx of workers are employed across a wide range of industries. Every major industry had more employees move in the state than move out from 2020 to 2022 (Chart 5, Panel A)._ The Retail Trade and Business and Professional Services industries saw the largest increases after experiencing outflows from 2015 to 2019. The state also had a net increase in college graduates in every industry except Manufacturing and Transportation, Warehousing, and Utilities, with Retail Trade getting the largest net gain of about 3,800.
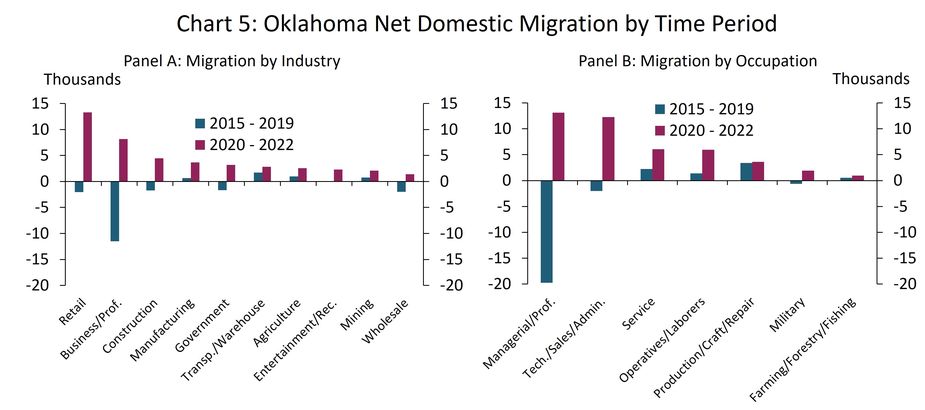
Note: Sample is limited to employed individuals age 25+.
Sources: ACS 1-year estimates/IPUMS USA, University of Minnesota, www.ipums.org, authors’ calculations
Each major occupational category added workers both with and without bachelor's degrees on net from 2020 to 2022. Managerial and Professional workers saw the largest net increases, adding nearly 8,200 non-college graduates and over 4,600 college graduates, after losing workers on net from 2015 to 2019 (Chart 5, Panel B)._ Oklahoma also netted about 9,500 people working in Technical, Sales, and Administrative positions without a bachelor's degree and nearly 2,600 with a bachelor's degree since 2020.
In addition, Oklahoma reversed its loss of high earners to other states during the pandemic and gained many prime borrowers. From 2015 to 2019, most people moving to Oklahoma were in the bottom two quartiles of the state’s income distribution and were not prime borrowers, and most people leaving the state were in the top two quartiles and were prime borrowers (Chart 6)._ Since 2020, the state increased gains in the top income quartiles, with nearly 40% of the net migrants in the top two quartiles of the state’s income distribution (Chart 6, Panel A)._ At peak migration in 2021, 57% of the net gains were in the top two quartiles. Additionally, the state added 16,300 prime borrowers and nearly 10,000 superprime borrowers from 2020 to 2023, both accounting for 55% of the total net gains (Chart 6, Panel B). However, as migration slowed in 2022, the top two income quartiles’ share of net gains shrunk to 14%. This could be because most of the people who moved during the pandemic were higher earners, and migration out of the country’s largest metro areas to places like Oklahoma slowed in 2022 and 2023 (Li & Su 2023; Whitaker 2023).
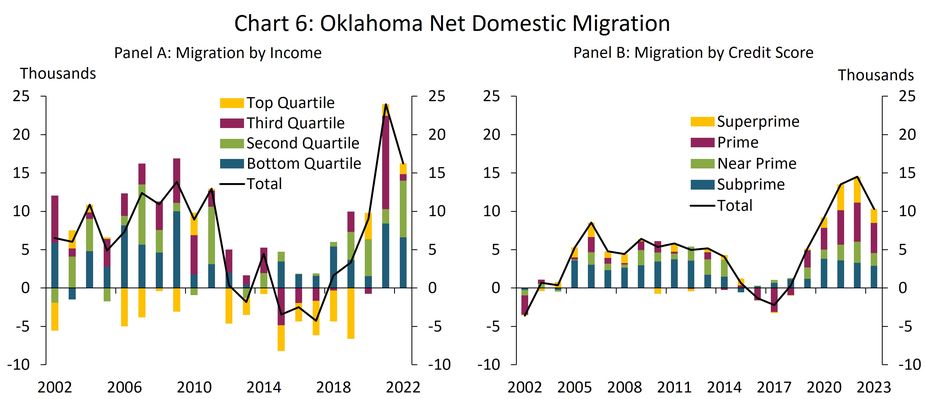
Note: Sample is limited to age 25+. Panel A is limited to those who reported income. Panel B is limited to those who had credit scores available. Credit categories are defined as follows: a score below 601 is subprime, 601 to 660 is near prime, 661 to 780 is prime, and 781 and above is superprime.
Sources: ACS 1-year estimates/IPUMS USA, University of Minnesota, www.ipums.org, FRBNY Consumer Credit Panel/Equifax, authors’ calculations
Summary and Conclusions
Most areas of Oklahoma gained residents since the pandemic. The Oklahoma City and Tulsa MSAs saw the most growth as many Americans moved from large metro areas to more affordable ones. Counties bordering the core of Oklahoma City and Tulsa added the most residents with the rise of working from home, but many smaller cities and rural areas also posted gains. Over half of the state’s new residents since the pandemic are working age and employed, making up for previous losses of employed residents and slightly raising the state’s labor force participation rate. These new workers are employed in a wide variety of industries and occupations, and the vast majority are not fully remote workers. Many of them are also high earners with good credit scores. Oklahoma’s economy has surely benefitted from this bout of pandemic migration, but whether this trend will continue as national migration slows remains to be seen.
Endnotes
- 1
-
2
Data cited here are from the New York Fed’s Consumer Credit Panel (CCP)/Equifax, a 5% representative sample of the nation comprised of anonymized credit reports containing millions of observations. Thus, it can undercount migration of lower income individuals without access to credit. It also naturally excludes people under the age of 18 and undercounts individuals under 25 relative to the American Community Survey’s estimates, as they are less likely to have opened lines of credit. However, we limit the sample to individuals aged 25 and older to eliminate college students’ migration in or out of Oklahoma solely for their studies. This restriction is especially relevant when looking at net migration from Texas, given the External Linkgrowing number of Texans attending the University of Oklahoma and Oklahoma State University. More information about the CCP can be found in the External LinkNew York Fed’s introductory paper to the CCP (Lee & van der Klaauw 2010).
- 3
-
4
Oklahoma’s small metropolitan areas are Lawton, Enid, and Fort Smith (Sequoyah County). The state’s micropolitan areas, as defined by the U.S. External LinkOffice of Management and Budget, are urban areas outside metropolitan areas with a resident population between 10,000 and 50,000.
-
5
The labor force participation rate is calculated as the number of people employed plus the number of people unemployed (looking for a job in the past 4 weeks) divided by the civilian working-age population (age 16+).
-
6
The industry classifications are based on the broad categories from the “Industry, 1990 basis” (IND1990) variable from the University of Minnesota’s External LinkIntegrated Public Use Microdata Series (IPUMS) of the American Community Survey (ACS). Business and Professional Services includes the Finance, Insurance, and Real Estate, Business and Repair Services, and Professional and Related Services industries.
-
7
The occupation classifications are based on the broad categories from the “Occupation, 1990 basis” (OCC1990) variable from IPUMS ACS.
-
8
The differences in the aggregate estimates each year between Panel A and Panel B are due to the different nature of the data sources. Panel A is sourced from the American Community Survey and Panel B is sourced from the FRBNY Consumer Credit Panel/Equifax, which is limited to those with credit reports. More details about the data sources for comparison can be found in the endnotes of the External Linkprevious edition of Oklahoma Economist.
-
9
The household income quartiles for each year are calculated for the sample of all individuals living in Oklahoma and those who moved out of Oklahoma each year. Thus, the quartiles are inflation-adjusted.