U.S. production of crude oil has steadily trended higher in recent years despite declines in crude oil prices. Chart 1 shows that the price of benchmark West Texas Intermediate (WTI) crude oil fell starting in mid-2014 and was followed promptly by a large reduction in the number of active drilling rigs. However, U.S. oil and gas production has continued to increase almost uninterrupted. In fact, in 2018, the United States became the world’s largest producer of crude oil (Energy Information Administration 2018). The steady rise in production at a time when oil prices and rigs declined suggests that productivity within the oil and gas sector has increased.
Chart 1: U.S. Oil Production Increases Despite Lower Oil Prices
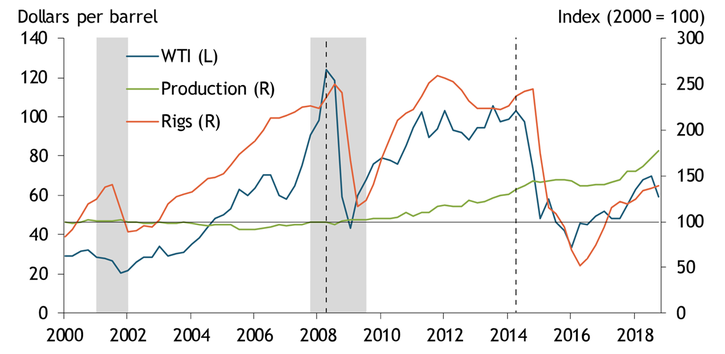
Notes: Grey shading denotes NBER-defined recessions. Dashed vertical lines mark the 2008 oil price peak, and the recent peak (June 2014) of crude oil prices.
Sources: Baker Hughes, Bloomberg, and Energy Information Administration (Haver Analytics).
To explore this possibility, we construct a new measure of drilling productivity, or the amount of oil and gas produced in the first 12 months of new wells on a per rig basis. We focus on active drilling rigs, as rigs are a commonly used measure of drilling activity and one of the primary forms of capital used in the extraction of oil and gas (Baker Hughes). Our productivity measure includes information from the lower 48 states on the number of on-shore producing wells that each rig drills, the depth of each well, and the amount of oil and gas each well generates in the first 12 months of production. We measure the combined production of oil and gas on a barrel of oil equivalent (BOE) basis. This measure of drilling productivity is innovative in that we provide insight into the below-ground components of efficiency—average drilled foot per well and production per drilled foot—not highlighted in alternate measures of efficiency (EIA 2019). In our measure, drilling productivity is determined by rig productivity and well productivity, which approximate above- versus below-ground components._
Our measure reveals that drilling productivity had a relatively flat to slightly declining trajectory until 2008. Chart 2 shows an accelerated rise in productivity following the 2008 and 2014 oil price peaks, highlighted by the dashed vertical lines. After the 2014 oil price peak, productivity skyrocketed to just above 1.0 million barrels per rig in the first quarter of 2017. Although drilling productivity was on a slightly positive trajectory after 2009, the dramatic price decline from June 2014 to February 2016 catalyzed an accelerated rise in productivity. When prices fall, drillers are known to shift their focus to higher-quality resources and operate only the most productive rigs and crews. This process is known as “high grading,” and will tend to drive up productivity levels while prices are in decline. As prices rise, firms return to drilling lower-quality assets and begin to use lower-productivity (higher-cost) capital (Kleinberg and others 2018). Indeed, as oil prices rebounded from their 2016 lows, drilling productivity slowed to 800,000 barrels per rig by the end of 2017.
Chart 2: Drilling Productivity Measured as First 12-Month Production per Rig
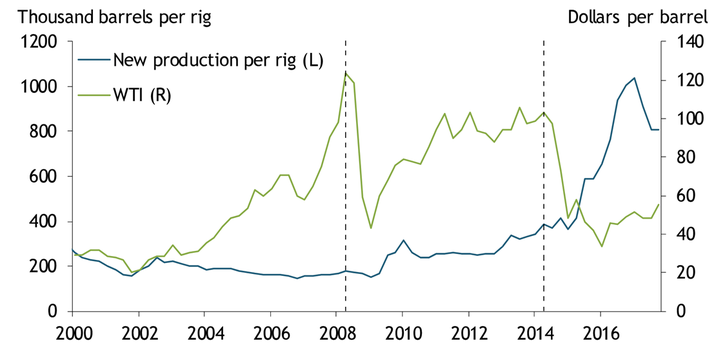
Notes: Dashed vertical lines mark the 2008 and 2014 oil price peaks. Rigs are lagged by one quarter to align them with the start of production. All data are seasonally adjusted according to the Census X-13 program.
Sources: Drillinginfo, Baker Hughes (Haver Analytics), and authors’ calculations.
In addition to oil price dynamics and high grading, technology-driven changes in above- or below-ground efficiency could explain longer-term changes in overall drilling productivity. Technologies such as hydraulic fracturing and horizontal drilling have fostered several changes in domestic oil production over the past decade (Çakir Melek 2015)._ For example, rigs used in horizontal drilling are able to drill multiple wells on the same well pad rather than uprooting and moving (EIA 2012). However, this advantage does not seem to have led to a significant boost in above-ground productivity. Chart 3 shows that the number of producing wells drilled per rig was actually on a steady decline from 2000 to 2009. Aside from brief spikes in 2010 and 2016, rig productivity has been relatively flat at around six producing wells drilled per rig in each quarter. Thus, increases in overall drilling productivity cannot be explained by above-ground rig productivity, as this component is actually a flat or negative contributor to overall productivity over time.
Chart 3: Rig Productivity Measured as Wells Drilled Per Rig
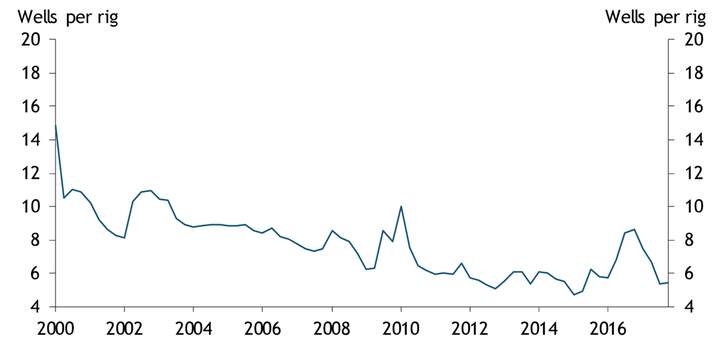
Notes: Rigs are lagged by one quarter to align them with the start of production. All data are seasonally adjusted according to the Census X-13 program.
Sources: Drillinginfo, Baker Hughes (Haver Analytics), and authors’ calculations.
While rig productivity has been relatively flat over the past two decades, well productivity has surged. The number of barrels of new production per well increased sixfold from 20,000 barrels in 2000 to over 150,000 barrels in 2017 (Chart 4). Over the same period, the average depth of a producing well also increased from about 6,000 feet to 13,000 feet. While our data do not distinguish between vertical depth and horizontal length, Montgomery and O’Sullivan (2017) show that the increase in average total depth is a result of longer horizontal wells being drilled to expose more of the rock formation in preparation for hydraulic fracturing.
Chart 4: Well Productivity and Total Depth of Wells
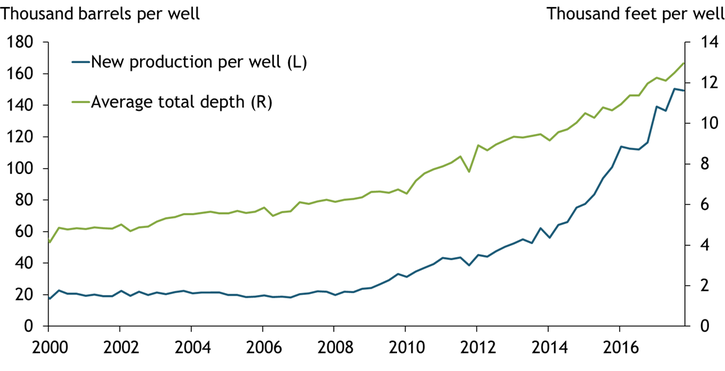
Note: All data are seasonally adjusted according to the Census X-13 program.
Sources: Drillinginfo and authors’ calculations.
The increase in well productivity is not just due to longer wells. Chart 5 shows that the number of barrels per foot drilled has also increased over time. Wells drilled in the early to mid-2000s yielded around 4 to 5 barrels of oil per foot in their first year of production. By 2017, new wells yielded around 12 barrels of oil per foot. This below-ground productivity increase is attributable to both technological improvements and the increased use of inputs such as frac sand and proppant to fracture the rock formations and extract hydrocarbons (Oxford 2017).
Chart 5: Below-Ground Efficiency Measured as Barrels of New Production per Foot Drilled
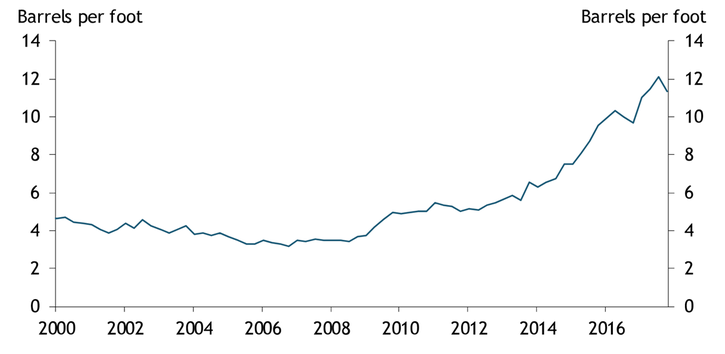
Note: All data are seasonally adjusted according to the Census X-13 program.
Sources: Drillinginfo and authors’ calculations.
Overall, our analysis suggests that the recent increases in drilling productivity were mostly driven by what lies beneath—that is, increases in below-ground efficiency (production per well) rather than above-ground efficiency (the number of wells drilled per rig). However, it is unclear whether these increases will continue. As oil prices moved higher throughout 2017, drilling productivity decreased. Despite the more recent softening in productivity, U.S. oil production will likely continue to advance in the near future, as WTI in the $60–64 per barrel range is currently priced above reported average profitable prices in the first quarter of this year (KCFed Energy Survey 2019). However, additional large increases in drilling productivity are unlikely unless drilling technology continues to improve or until oil prices turn down.
Endnotes
-
1 Specifically, Drilling Productivity = Rig Productivity × Well Productivity, where Rig Productivity = Wells Drilled / Rig, Well Productivity = New Production per Well = (New Production / Drilled Feet) × (Drilled Feet / Well). Rig counts are from Baker Hughes. Wells drilled, new production, and drilled feet are tabulated using data from Drillinginfo. Data are quarterly.
-
2 Unconventional or shale oil and gas production became an increasing share of U.S. production, rising from roughly 4 percent in 2000 to over 50 percent in 2017 (Rodziewicz 2018).
References
Baker Hughes. 2019. “External LinkNorth America Rig Count,” April.
Çakır Melek, Nida. 2015. “What Could Lower Prices Mean for U.S. Oil Production?” Federal Reserve Bank of Kansas City, Economic Review, vol. 100, no. 1, pp. 51–69.
Curtis, Trisha, and Benjamin Montalbano. 2017. “External LinkCompletion Design Changes and the Impact on U.S. Shale Well Productivity.” Oxford Institute for Energy Studies, Energy Insight, vol. 21, November, pp. 1–16.
Energy Information Agency (EIA). 2019. “External LinkDrilling Productivity Report,” April 15.
———. 2018. “External LinkThe United States is Now the Largest Global Crude Oil Producer,” Today in Energy, September 22.
———. 2012. “External LinkPad Drilling and Rig Mobility Lead to More Efficient Drilling,” Today in Energy, September 11.
Kleinberg, R.L., S. Paltsev, C.K.E. Ebinger, D.A. Hobbs, and T. Boersma. 2018. “External LinkTight Oil Market Dynamics: Benchmarks, Breakeven Points, and Inelasticities.” Energy Economics, vol. 70, February, pp. 70–83.
Montgomery, J.B., and F.M. O’Sullivan. 2017. “External LinkSpatial Variability of Tight Oil Well Productivity and the Impact of Technology.” Applied Energy, vol. 195, June, pp. 344–355.
Rodziewicz, David. 2018. “Energy Investment Variability Within the Macroeconomy.” Federal Reserve Bank of Kansas City, Economic Review, vol. 103, no. 3, pp. 53–75.
Wilkerson, Chad 2019. “Tenth District Energy Activity Flat, Outlook Higher.” Federal Reserve Bank of Kansas City, Tenth District Energy Survey, April 12.
Jason P. Brown is an assistant vice president and economist, David Rodziewicz is a senior commodity specialist, and Colton Tousey is an assistant economist at the Federal Reserve Bank of Kansas City. The views expressed are those of the authors and do not necessarily reflect the positions of the Federal Reserve Bank of Kansas City or the Federal Reserve System.
Authors

Jason P. Brown
Vice President and Economist

David Rodziewicz
Advanced Economics Specialist