After trending down for a few years, Chinese real gross domestic product growth stabilized in recent quarters (Chart 1). Positive data in the first half of the year regarding manufacturing activity, retail sales, and exports surprised forecasters to the upside, causing several large institutions, such as the International Monetary Fund (IMF) and the Organization for Economic Cooperation and Development (OECD), to upgrade their forecasts for Chinese growth.
Chart 1: Chinese Real GDP Growth
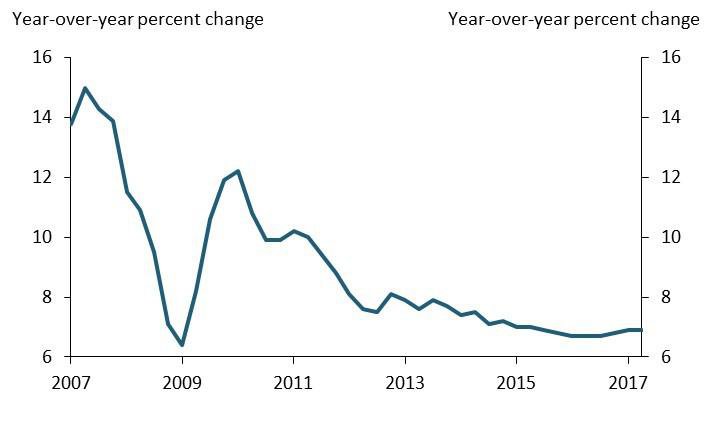
Sources: China National Bureau of Statistics (Haver Analytics).
The recent slate of positive data has also sparked a debate about whether the Chinese economy is experiencing a temporary rebound or a more sustainable upturn in growth. Answering this question is difficult. The Chinese economy is undergoing a transition in which economic growth is rising in some sectors of the economy but declining in others. At the same time, China’s official quarterly GDP figures have been criticized for being overly smooth and less informative. Moreover, Chinese government policies have stimulated or cooled the economy at different times, further muddling the signal from economic data. To better assess whether the recent uptick in growth is sustainable, we use a factor analysis of monthly measures of Chinese economic and policy activity in key sectors to uncover the underlying momentum and determinants of Chinese growth.
Our monthly data covers seven categories of activity: consumer spending, manufacturing and production, investment, real estate and finance, services, trade, and government policies. Chart 2 lists the variables we use, which come from multiple sources such as China’s National Bureau of Statistics, the Commerce Department, and the private sector. These variables capture activities most relevant to Chinese growth and measure growth from different angles. We focus on the last nine years, starting around the time the Chinese economy began its transition.
Chart 2: A Heat Map of Correlations between the Data and the Factors
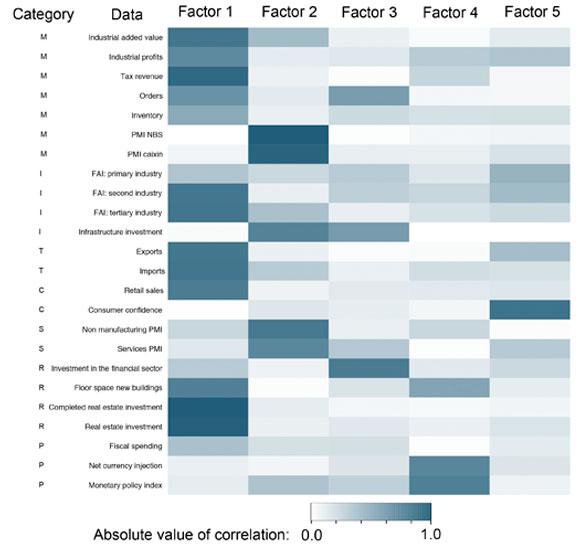
Note: “M” corresponds to manufacturing, “I” corresponds to investment, “T” corresponds to trade, “C” corresponds to consumption, “S” corresponds to services, “R” corresponds to real estate and finance, and “P” corresponds to policy.
Sources: Wind and authors’ calculations.
Our analysis yields three main findings. First, we find that no single common factor explains the majority of the variation in Chinese activity. This is consistent with the view that the Chinese economy is in a transition, so different sectors are less synchronized. Indeed, our analysis shows that the five most important factors together account for about 75 percent of the total variation in the selected Chinese data (Table 1).
Table 1

Notes: Factors are generated by a principal components estimation. The data used are listed in Chart 2. All activity variables are year-over-year growth; all indexes are changes from 12 months earlier.
Among these five factors, Factor 1 explains about 36 percent of the total variation in the data and has strong correlations with key variables describing different sectors of the Chinese economy. Chart 2 provides a heat map of the correlations, in absolute terms, between the selected data and each of the five factors, with a darker color indicating a stronger correlation.
The strong correlations between Factor 1 and a wide range of measures of activity suggest that Factor 1 could serve as an overall measure of momentum in Chinese economic activity. Indeed, Chart 3 shows that Factor 1 closely tracks normalized Chinese real GDP growth but fluctuates more (for comparison purposes, we convert our monthly measure to a quarterly frequency)._ The chart highlights weakness in real GDP growth in the last two years and confirms the recent pickup in momentum.
Chart 3: Chinese Official GDP Growth and Factor 1
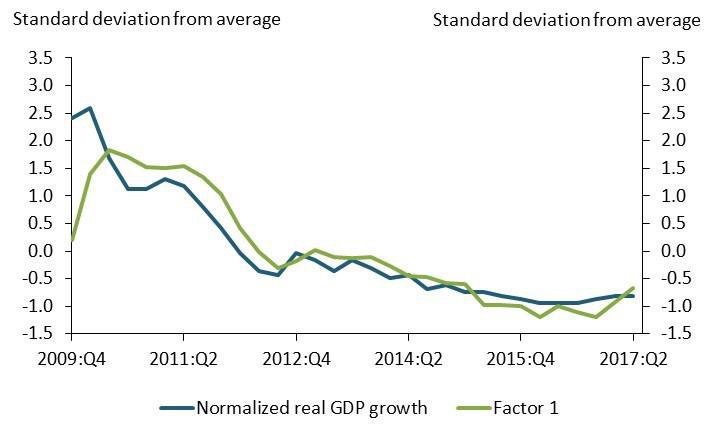
Sources: Wind and authors’ calculations.
Second, we find that government policies have played an important role in China’s economic performance. Three of the most important factors are highly related to government policies. As Chart 2 shows, Factor 2 is highly correlated with both the Purchasing Managers Index (PMI), a measure of manufacturing activity, and infrastructure investment. As Chinese fiscal policy has often targeted industrial production and infrastructure investment, we can view this factor as measuring the stance of fiscal policy. Indeed, Chart 4 shows that Factor 2 rose sharply around 2009, coinciding with a large stimulus package in China of 4 trillion Chinese yuan (about 600 billion U.S. dollars) following the global financial crisis.
Similarly, Factor 3 is highly correlated with financial investment, which is subject to changing financial regulations. The Chinese government’s ongoing financial tightening in response to rising financial risks likely makes this factor more sensitive to the government’s policies. In addition, Factor 4 clearly represents the stance of monetary policy: the factor is strongly correlated with the monetary policy index, which summarizes over 50 different Chinese interest rates, and the central bank’s currency injection.
Chart 4: Factors Related to Policy Variables
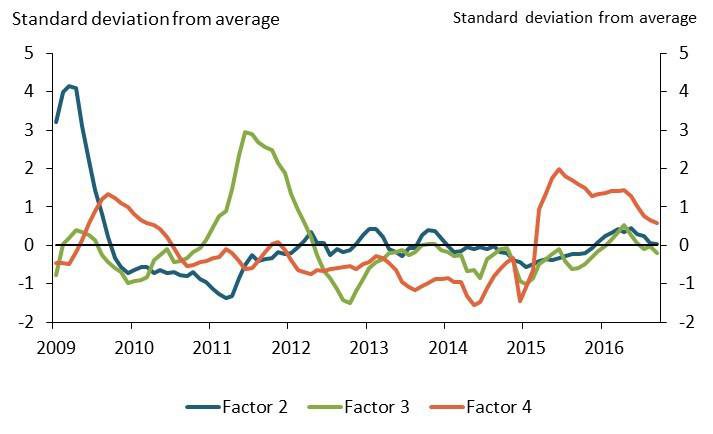
Note: Values shown are three-month moving averages.
Sources: Wind and authors’ calculations.
Third, our analysis indicates that the momentum of Chinese growth is likely to slow in the near term. Chart 5 shows the contributions of different variables to Factor 1, our main measure of overall economic activity. To simplify the analysis, we group the variables into four major categories: manufacturing, investment, and trade activities; consumer spending and services; the real estate and financial sectors; and government policies. The vertical axis shows each group’s deviations from its average level. The black line, for example, shows that Factor 1 was about two standard deviations above its average level in the middle of 2009 and about one standard deviation below its average level in 2016._ The chart shows that a smaller contribution from the manufacturing, investment, and trade group has likely driven the downward trend. Growth in investment and exports has been slowing significantly due to declining returns to capital and rising labor costs in China. In contrast, the contribution from the consumption and services group has been relatively stable, consistent with the fact that Chinese consumption growth has been relatively more stable in the last few years due to more stable income growth.
Chart 5: Contributions of Different Data Categories to Factor 1
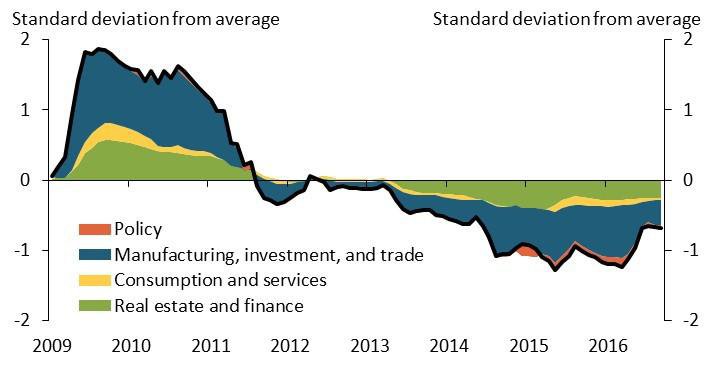
Sources: Wind and authors’ calculations.
Turning to the more recent period, Chart 5 shows that the pickup in Factor 1 since 2016 was mainly driven by improvement in the manufacturing, investment, and trade group—as shown by the narrowing blue area on the right hand side of the chart—and assisted by small improvements in the consumption and services group (yellow area) and policy group (orange area). As China is transitioning from an investment- and export-driven economy to a more consumption-driven economy, the recent improvement in the manufacturing, investment, and trade group is likely to be temporary. Indeed, this improvement may reflect the rebound in global commodity prices that led to higher industrial profits and production; an increase in fiscal spending, which supported investment; and improvement in global growth coupled with the depreciation in the Chinese currency at the end of last year, which boosted Chinese exports. These driving forces may prove to be temporary, casting doubts on the sustainability of recent strength in the manufacturing, investment, and trade group.
Furthermore, policy-related factors have continued to fall from their elevated levels, generating additional downward pressure on recent momentum in Chinese economic activity. As Chart 4 shows, the factor representing the stance of monetary policy (Factor 4) jumped up to its highest level in 2015, the weakest period for Chinese economic activity as measured by our overall activity index (Factor 1, shown in Chart 3). Since then, Factor 4 has gradually returned to a more normal level as economic conditions improve. The factor related to fiscal policy (Factor 2) has also recently returned to its average level. In contrast, the factor related to the financial sector (Factor 3) has dropped below its average level, reflecting the government’s recent decision to tighten financial regulations to control financial risks. In general, these movements are consistent with the Chinese government’s recent efforts to fight rapidly rising credit growth to promote more sustainable long-run growth. However, the movements of our estimated factors suggest these efforts are likely to pose downside risks to near-term growth.
Endnotes
-
1 The normalized real GDP growth rate is defined as the number of standard deviations from average growth, which has the same unit as the estimated factors.
-
2 The contributions from all four categories should equal Factor 1 (black line). Careful readers may notice an orange area below the black line around 2015. This is because the contribution of the policy variables during that time was positive, while the contributions of other variables were generally negative.
Jun Nie is a senior economist at the Federal Reserve Bank of Kansas City. Yandong Jia is a researcher at the Research Bureau of the People’s Bank of China. Amy Oksol, a research associate at the bank, helped prepare the bulletin. The views expressed are those of the authors and do not necessarily reflect the positions of the Federal Reserve Bank of Kansas City, the Federal Reserve System, or the People’s Bank of China.
The views expressed are those of the authors and do not necessarily reflect the positions of the Federal Reserve Bank of Kansas City or the Federal Reserve System.