Two years into the pandemic, the labor force participation rate remains one percentage point below its pre-pandemic level despite signs of strong labor demand. A natural question for policymakers is how much of the decline in the size of the labor force has been driven by “missing” workers, who may yet return, rather than demographic factors such as slower population growth and an aging population. Accounting for these forces is crucial in assessing how many workers are truly missing from the labor force relative to the pre-2020 trend._
A natural starting point in calculating the size of the missing labor force is comparing the current size of the labor force to its pre-pandemic trend. I use data from the U.S. Census Bureau’s Current Population Survey to estimate the size of the U.S. labor force in March 2022 if it had continued to grow at its 2015–19 trend during the pandemic._ The green line in Chart 1 shows how the size of the labor force would have evolved under this trend. The difference between the green line and the blue line (the actual size of the labor force) corresponds to around 3.6 million individuals as of March 2022. This estimate is similar to that of Barrero, Bloom, and Davis (2022), who report a shortfall of 3.5 million workers relative to the pre-pandemic trend.
Chart 1: Around 2 million workers are missing from the U.S. labor force after accounting for slower population growth and the aging of the population in the past two years
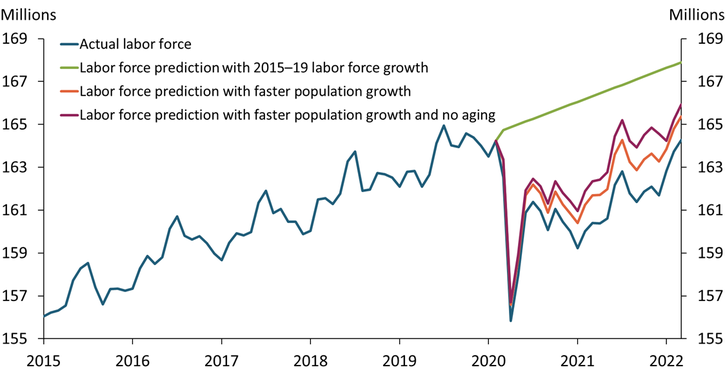
Sources: U.S. Census Bureau and author’s calculations.
However, this shortfall estimate is misleading because it does not account for the decline in population growth over the past two years. Changes in the size of the aggregate labor force can be driven by changes in the size of the population as well as changes in the rate at which the population participates in the labor force. Although the U.S. population (age 16 and older) grew by 3.8 million between February 2020 and March 2022, the pace of population growth was slower than its pre-pandemic trend. Had the U.S. population continued to grow at its 2015–19 pace after February 2020, an additional 1.8 million people would be living in the United States, many of whom may have joined the labor force._
One important contributor to the decline in population growth has been the reduction in immigration to the United States due to both pre-pandemic changes in immigration policy and COVID-19-related immigration and travel restrictions. For example, Peri and Zaiour (2022) report that an immigration shortfall in the past two years resulted in 2 million fewer working-age immigrants living in the United States than there would have been had immigration continued its pre-2020 trend.
To account for the effect of slower population growth, I construct a counterfactual path for the labor force assuming the U.S. population had continued to grow at its 2015–19 pace after February 2020. The orange line in Chart 1 shows that faster population growth would have increased the size of the labor force. The difference between the orange line and the blue line (the actual size of the labor force) indicates that about 1.1 million fewer people were in the labor force as of March 2022 due to slower population growth. The difference between the orange line and the green line (the implied size of the labor force had its 2015–19 trend continued) indicates that accounting for slower population growth shrinks the size of the “missing labor force” to around 2.5 million workers.
Population growth is not the only demographic change that can influence the size of the labor force—an aging population can also reduce the size of the labor force, as older adults have persistently lower participation rates than younger adults. To account for the aging of the population since 2020, I calculate changes in the population shares of 14 age-gender groups, corresponding to groups of men and women in seven age ranges: 16–24, 25–34, 35–44, 45–54, 55–64, 65–74, and 75 and older._ The aging of the population over the past two years led to increases in the population shares of older individuals, who have lower participation rates than younger individuals, thereby shrinking the size of the labor force. For example, the population share of individuals age 65 and older increased from 20.8 in February 2020 to 21.3 percent in March 2022, corresponding to around 2.2 million more people in these age groups.
To gauge how this aging has influenced the labor force, I construct another counterfactual path for the labor force assuming the U.S. population grew at its 2015–19 pace and that the population shares of different demographic groups did not change from their February 2020 levels (no aging). The maroon line in Chart 1 shows the path of the labor force under these assumptions. The gap between the maroon and orange lines shows that the labor force would have 0.5 million more workers had the population shares of older adults not increased. The gap between the green and maroon lines—the implied missing labor force—shows that accounting for this aging shrinks the size of the “missing labor force” further, to around 2 million workers as of March 2022.
Who are these 2 million workers? To answer that question, I next focus on the age composition of the missing labor force. I calculate how many more workers from the 14 age-gender groups would be in the labor force had their labor force participation rates returned to February 2020 levels. For a simpler comparison, I report aggregated numbers for prime-age individuals (age 25–54), individuals age 55–64, and individuals age 65 and older. Chart 2 shows that until recently, prime-age individuals accounted for a majority of the missing labor force. However, more prime-age workers have returned to the labor force in recent months, and individuals age 65 and older now make up the largest group of missing workers. More specifically, individuals age 65 and older account for almost 66 percent of the missing labor force as of March 2022, while prime-age individuals account for only 31 percent.
Chart 2: Older adults constituted most of the missing labor force in March 2022
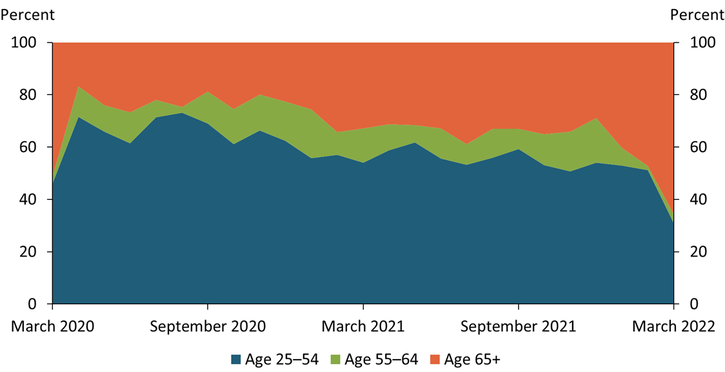
Sources: U.S. Census Bureau and author’s calculations.
Consistent with this finding, the labor force participation rate of older adults is farthest from a full recovery. Chart 3 plots the aggregate labor force participation rate of all individuals age 16 and older (maroon line), as well as the participation rates for the three age groups, indexed to their February 2020 levels. The labor force participation rates of all groups declined dramatically at the onset of the pandemic as temporary shutdown orders and social distancing measures to fight the virus outbreak caused many to exit the labor force. From April 2020 to the end of 2021, the participation rates have been recovering, albeit slowly, as reopened schools and daycares have allowed prime-age parents to gradually return to work, and increased vaccination rates have led service-sector workers to feel safer returning to work. The recovery in the labor force participation rates has accelerated in 2022 as pandemic fears eased even more. As of March 2022, the participation rates of all age groups except the 65+ age group had almost fully recovered to their pre-pandemic levels. In contrast, the participation rate of the 65+ age group (orange line), which experienced the largest decline at the onset of the pandemic, has remained persistently below its pre-pandemic levels since.
Chart 3: The labor force participation rate of people age 65+ remains farthest from a full recovery
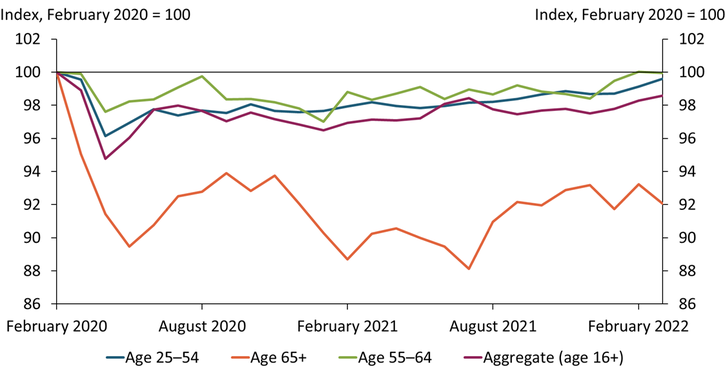
Sources: U.S. Census Bureau and author’s calculations.
Overall, my calculations suggest that, compared with early 2020, around 2 million workers are missing from the labor force after accounting for both slower population growth and the aging of the U.S. population over the past two years. Currently, individuals age 65 and older make up the majority of the missing labor force as their labor force participation rate has remained persistently below pre-pandemic levels throughout the recovery. Increases in the size of the aggregate labor force in the near term will depend on the pace of recovery in the labor force participation rates of these older groups and further increases in the prime-age labor force participation rate, which had been on an increasing trend in the 2015–19 period (Tüzemen and Tran 2019).
Endnotes
-
1
The pre-pandemic period is a useful benchmark for the purpose of this article, but not does not necessarily represent the optimal trend for the size of the labor force.
-
2
I obtain the 2015–19 trend growth by estimating a linear trend from January 2015 to December 2019 and use this trend to predict the level of the labor force after February 2020, similar to the calculation used by Barrero, Bloom, and Davis (2022). I use micro-level data from the U.S. Census Bureau’s Current Population Survey (cosponsored by the Bureau of Labor Statistics) that are not seasonally adjusted.
-
3
I repeat a similar estimation for the U.S. population level (age 16 and older) as above.
-
4
I consider age-gender groups in these calculations, as men and women within the same age group have very different labor force participation rates. However, decomposing the missing labor force by gender is beyond the scope of this article.
References
Barrero, Jose Maria, Nicholas Bloom, and Steven J. Davis. 2022. “External LinkThe Long Social Distancing.” April 15.
Peri, Giovanni, and Reem Zaiour. 2022. “External LinkLabor Shortages and the Immigration Shortfall.” Econofact, January 11.
Tüzemen, Didem, and Thao Tran. 2019. “External LinkWomen Are Driving the Recent Recovery in Prime-Age Labor Force Participation.” Federal Reserve Bank of Kansas City, Economic Bulletin, December 18.
Didem Tüzemen is a senior economist at the Federal Reserve Bank of Kansas City. The views expressed are those of the author and do not necessarily reflect the positions of the Federal Reserve Bank of Kansas City or the Federal Reserve System.