Although U.S. employment has rebounded to pre-pandemic levels, demand for additional labor remains strong. Chart 1 shows that job openings or vacancies (blue line) have increased dramatically since 2020, rising from 7 million in February 2020 to a peak of around 11.9 million in March 2022. This increase far outpaced the moderate increase in vacancies over the 2015–19 period, when vacancies rose from an average of 5.6 million in 2015 to an average of 7.2 million in 2019. Job openings declined significantly to 10.1 million in August 2022 but remain elevated compared with the pre-pandemic level and trend. The green line in Chart 1 shows how vacancies would have evolved if they had grown at the 2015–19 rate._ The difference between the green line and the blue line corresponds to more than 1.4 million job openings. This elevated level of vacancies shows that labor demand is still stronger than it was before the pandemic.
Chart 1: Job openings in August 2022 have exceeded their 2015–19 trend by more than 1.4 million
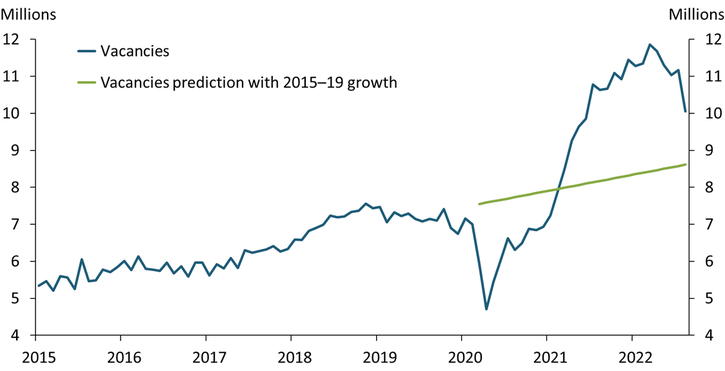
Note: Job openings or vacancies are from the U.S. Bureau of Labor Statistics (BLS) Job Openings and Labor Turnover Survey (JOLTS), which measures the “stock” of vacancies open on the last business day of the month.
Sources: BLS and author’s calculations.
In contrast, labor supply is below pre-pandemic levels. As of September 2022, the labor force participation rate was 1.1 percentage point below its February 2020 level despite strong labor demand. The aggregate labor force participation rate is most affected by changes in the participation rates of individuals who are prime-age (age 25–54) and who are age 55+, as these groups correspond to the largest shares in total population._ As of September 2022, prime-age individuals accounted for 48.1 percent of the total population, while individuals age 55+ accounted for 37.5 percent. Chart 2 shows the aggregate labor force participation rate (age 16+), as well as the participation rates of these two groups indexed to their February 2020 levels. Although the prime-age participation rate has almost fully recovered to pre-pandemic levels, the participation rate of individuals age 55+ remains about 4 percent below pre-pandemic levels, contributing to the weakness in the aggregate labor force participation rate.
Chart 2: Labor force participation rate of people age 55+ remains persistently below pre-pandemic levels
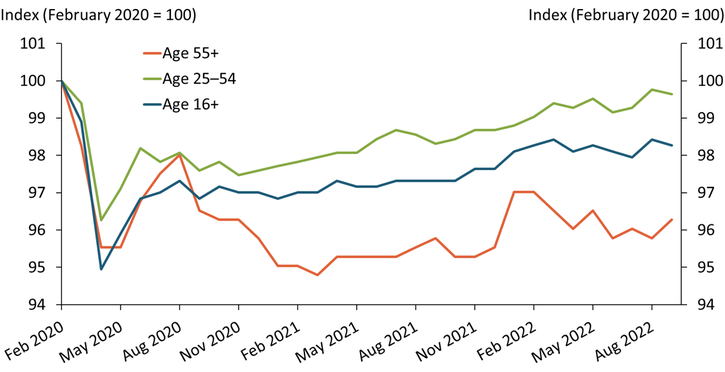
Note: Data are seasonally adjusted.
Sources: BLS, U.S. Census Bureau, and author’s calculations.
Compounding this weakness is the aging of the U.S. population, which mechanically lowers the labor force participation rate, as the participation rate of older workers is lower than prime-age workers. To illustrate this point, I calculate changes in the population shares of four age groups—individuals age 16–19, 20–24, 25–54, and 55+—from February 2020 to September 2022. I then predict how the aggregate labor force participation rate would have evolved under two scenarios. The green line in Chart 3 shows my calculations for Scenario 1, in which I assume that the labor force participation rates of all age groups remained at their February 2020 levels throughout the pandemic. Under this scenario, the aggregate labor force participation rate would be 63.2 percent in September 2022, and about 2.4 million more individuals would be in the labor force compared with the actual level. However, the difference between the green line and the blue line (the actual aggregate labor force participation rate) highlights that even if the labor force participation rates of all age groups had returned to their February 2020 levels by September 2022, the aggregate labor force participation rate would be 0.2 percentage points below its pre-pandemic level. This difference is due to the aging of the population: the population share of individuals age 55+ rose from 37 percent in February 2020 to 37.5 percent in September 2022, while the population share of the prime-age group decreased from 48.5 percent to 48.1 percent.
Chart 3: Weak participation among people 55+ depresses the aggregate labor force participation rate
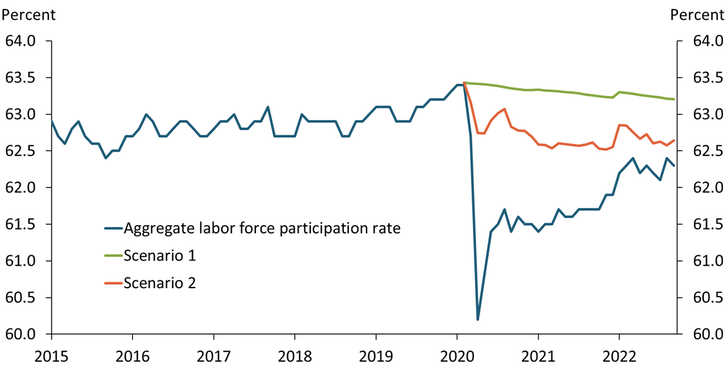
Note: Data are seasonally adjusted.
Sources: BLS, U.S. Census Bureau, and author’s calculations.
Even considering the aging of the population, the weaker labor force participation rate among older individuals is playing an outsized role in the recent fall-off in labor supply. The orange line in Chart 3 shows my calculations for Scenario 2, in which I assume the labor force participation rates of all age groups except the 55+ group had remained at their pre-pandemic levels to emphasize the effect of the decline in the participation rate of the 55+ group on the aggregate._ Under this scenario, the aggregate labor force participation rate in September 2022 would be 62.6 percent, which is almost a full percentage point lower than in February 2020 and close to the actual participation rate, suggesting that the fall-off among the 55+ population is largely responsible for the depressed labor supply. Notably, earlier in the pandemic this group accounted for only a small part of the decline in aggregate labor force participation, as evidenced by the large gap between the orange and blue lines. But as participation by other demographic groups has recovered, this group has shown almost no recovery. Therefore, while the aging of the population lowered the aggregate labor force participation rate, the persistent weakness in the labor force participation rate of older individuals accounts for most of the weakness in the aggregate participation rate compared with February 2020.
Going forward, the participation rate of individuals age 55+ may not fully recover to pre-pandemic levels. Chart 4 plots the labor force participation rate of individuals age 55+ since 2010 to provide a longer-term view. From 2010 to 2020, the participation rate of this group fluctuated around 40 percent. However, the participation rate of individuals 55+ took a large hit during the pandemic and has been fluctuating below 39 percent since. Increased retirement seems to be behind this seemingly persistent shift in participation. In September 2022, nonparticipation among the 55+ group was 3.3 million greater than in February 2020, almost entirely due to an increase in retirement among individuals age 65 and older._
Chart 4: Labor force participation rate of people 55+ may not return to pre-pandemic levels
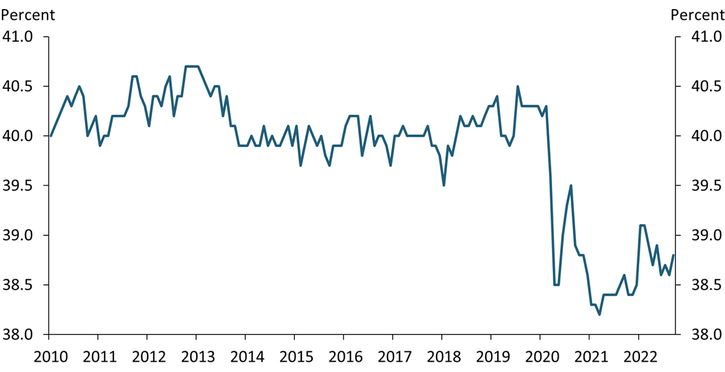
Note: Data are seasonally adjusted.
Sources: BLS and U.S. Census Bureau.
To conclude, relative to pre-pandemic trends, labor demand remains robust even as labor supply remains impaired. Even if the labor force participation rates of different age groups were to return to pre-pandemic levels, the aging of the population would still weigh on the aggregate labor force participation rate. However, I show that most of the weakness in the aggregate labor force participation rate is due to a lower participation rate among older individuals who may not return to the labor force, suggesting that labor supply will likely remain below pre-pandemic levels. Therefore, the labor market may remain tight until labor demand cools further.
Endnotes
-
1
To compare the current level of vacancies with its pre-pandemic trend, I estimate the level of vacancies in July 2022 if vacancies had continued to grow at the 2015–19 trend. I obtain the 2015–19 trend growth by estimating a linear trend from January 2015 to December 2019 and use this trend to predict the level of vacancies after February 2020.
-
2
The aggregate labor force participation rate corresponds to the sum of the labor force participation rates of different age groups weighted by their population shares.
-
3
As of September 2022, the labor force participation rate for only the age 16–19 group had fully recovered to pre-pandemic levels.
-
4
As shown in Tüzemen (2022), the labor force participation rate of the age 65+ group had the largest decline of all groups at the onset of the pandemic and has remained persistently below pre-pandemic levels since then. Based on the non-seasonally adjusted micro-level data from the U.S. Census Bureau’s Current Population Survey, nonparticipation rose by 3.1 million among the 65+ group as almost 3 million more individuals in this age group reported retirement (while not participating in the labor force) since February 2020.
Reference
Tüzemen, Didem. 2022. “External LinkHow Many Workers are Truly “Missing” from the Labor Force?” Federal Reserve Bank of Kansas City, Economic Bulletin, May 6.
Didem Tüzemen is a senior economist at the Federal Reserve Bank of Kansas City. The views expressed are those of the author and do not necessarily reflect the positions of the Federal Reserve Bank of Kansas City or the Federal Reserve System.