Measures of uncertainty from equity markets rose sharply during the fourth quarter of 2018 but quickly retreated. Chart 1 plots the recent evolution of the Chicago Board Options Exchange Volatility Index (VIX), which measures uncertainty about the S&P 500 stock index over the next 30 days. The VIX averaged about 13 in the third quarter of 2018, well below its longer-run historical average around 19. However, the VIX jumped up in October 2018 and spiked near the end of the year, raising its average level in 2018:Q4 above 21. By the start of 2019, the VIX had begun to fall rapidly, and the VIX remained low throughout 2019:Q1. Because the VIX is a common proxy for broader financial market conditions, this recent rise in equity market uncertainty suggests financial conditions tightened significantly in 2018:Q4.
Chart 1: Recent Evolution of the VIX
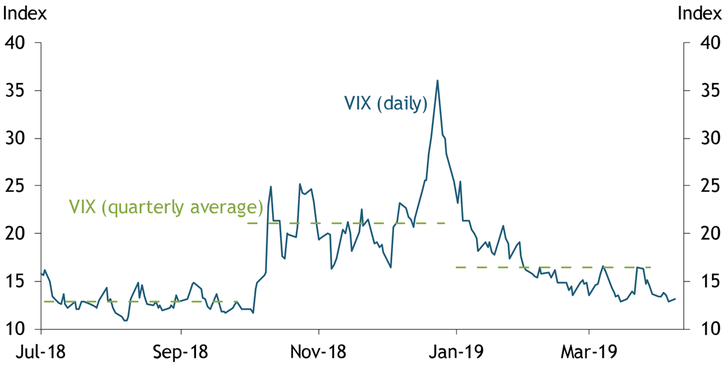
Source: Chicago Mercantile Exchange (Haver Analytics).
While this rise in uncertainty was temporary, its macroeconomic effects may be persistent. Historical evidence suggests that even short-lived increases in uncertainty can have longer-term effects on the macroeconomy. I use historical data in a statistical model to estimate the effects of this recent tightening in financial conditions._ Chart 2 plots the model-implied effects of the 2018:Q4 spike in uncertainty on real gross domestic product, the personal consumption expenditures price index excluding food and energy components (core PCE), and the federal funds rate._
Chart 2: Responses to Higher Uncertainty
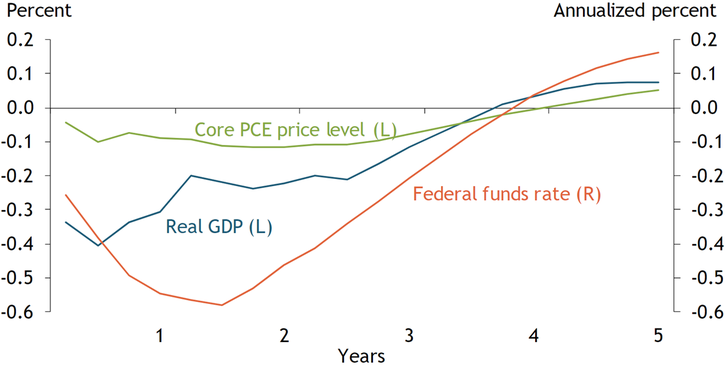
Sources: Bureau of Economic Analysis, Board of Governors of the Federal Reserve System, and author’s calculations.
The statistical model suggests that a temporary increase in uncertainty produces a significant decline in real GDP and a modest decline in prices over the next couple of years. The rise in uncertainty about the future leads households and firms to cut back their spending, causing about a 30 basis point drop in GDP for about two years after the shock. This decline in demand, in turn, puts slight downward pressure on consumer prices. As a result of both lower economic activity and declining inflationary pressures, policymakers lower the nominal policy rate. On average, the statistical model predicts that the path of future policy rates will be about 50 basis points lower two years after the initial shock. While the model’s quantitative predictions are subject to some uncertainty, these findings illustrate that a short-lived tightening in financial conditions—such as the spike in the VIX in 2018:Q4—can have persistent effects on the broader macroeconomy._
The model predictions are generally consistent with recent revisions to policymakers’ projections in the Summary of Economic Projections (SEP). Table 1 shows how the median projections for real GDP growth, core PCE inflation, and the funds rate changed between the September 2018 and March 2019 SEPs. The median projection for real GDP growth in 2019 fell by 40 basis points from 2.5 percent in September 2018 to 2.1 percent in March 2019. Over the same period, the median projection for the appropriate path of the funds rate at the end of 2019 declined by 70 basis points, and projections for inflation fell modestly. These recent revisions suggest that policymakers anticipate slower growth in economic activity, lower inflation, and a more accommodative policy path, consistent with the statistical model’s predictions in response to the recent tightening in financial conditions.
Table 1: Median Projections from the September 2018 and March 2019 SEP
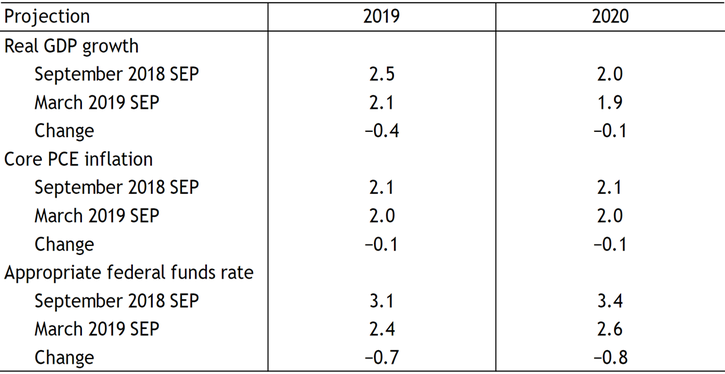
Notes: Projections for real GDP growth and core PCE inflation are the percent changes from the fourth quarter of the previous year to the fourth quarter of the year indicated. Projections for the funds rate denote the projections for the end of the year indicated.
Source: Federal Open Market Committee.
While the statistical model can estimate the macroeconomic effects of a rise in uncertainty, the model does not provide details on why the VIX rose at the end of last year. The VIX is a common proxy for broader financial conditions, which may respond to a variety of different factors. In addition, the recent revisions to the Summary of Economic Projections do not include information about the factors behind the markdown of the median projections. While the timing of the markdown in the median projections coincides with the typical decline in economic activity predicted by the statistical model, policymakers could be responding to a wide range of factors not fully captured by the model. However, both the statistical model and recent revisions to the SEP suggest a slower pace of economic activity, more subdued inflation, and a more accommodative policy path in 2019 than was predicted six months ago.
Endnotes
-
1 The statistical model is a vector autoregression (VAR) similar to the empirical model from Basu and Bundick (2017) estimated over the 1990:Q1–2018:Q4 period. The VAR includes the VIX, real GDP, consumption (nondurable goods and services), a measure of investment (private fixed investment plus consumer durable goods), hours worked, the core PCE price index, and M2. I also include the Wu-Xia (2016) shadow rate as a proxy for the central bank’s policy rate. Away from the zero lower bound, this rate equals the federal funds rate. However, during the zero-lower-bound period, this shadow rate uses information from the yield curve to summarize the stance of monetary policy when the federal funds rate is near zero. The VIX and the shadow rate enter the VAR in levels, while all other variables enter in log levels.
-
2 The effects of an uncertainty shock are identified using a Cholesky ordering with the VIX ordered first. This ordering assumes that uncertainty shocks can have an immediate effect on output and its components, but non-uncertainty shocks do not affect the VIX on impact. Basu and Bundick (2017) show that this ordering is supported by a common theoretical model of the macroeconomy. In addition, they document broadly similar empirical effects under alternative ordering schemes. To assess the effect of the 2018:Q4 rise in uncertainty, I scale the size of a single-period identified uncertainty shock such that the response of the VIX in the VAR matches the increase observed in the data during 2018:Q4. Chart 1 shows that the actual VIX increased by 8.19 from 2018:Q3 to 2018:Q4, equivalent to about a 2.5 standard deviation shock in the empirical model. Feeding this roughly 2.5 standard deviation shock into the VAR produces the impulse responses shown in Chart 2. After that single-period shock, I assume that the economy is not hit with any further shocks.
-
3 Using 80 percent probability intervals, the impulse responses for real GDP are statistically different from zero at impact and throughout the first year after the shock. The responses for the core PCE price index and policy rate are statistically different from zero at impact and remain statistically different from zero for the next four years after the shock.
References
Basu, Susanto, and Brent Bundick. 2017. “Uncertainty Shocks in a Model of Effective Demand.” Econometrica, vol. 85, no. 3, pp. 937−958.
Wu, Jing Cynthia, and Fan Dora Xia. 2016. “Measuring the Macroeconomic Impact of Monetary Policy at the Zero Lower Bound.” Journal of Money, Credit and Banking, vol. 48, no. 2−3, pp. 253−291.
Brent Bundick is a senior economist at the Federal Reserve Bank of Kansas City. The views expressed are those of the author and do not necessarily reflect the positions of the Federal Reserve Bank of Kansas City or the Federal Reserve System.
Author